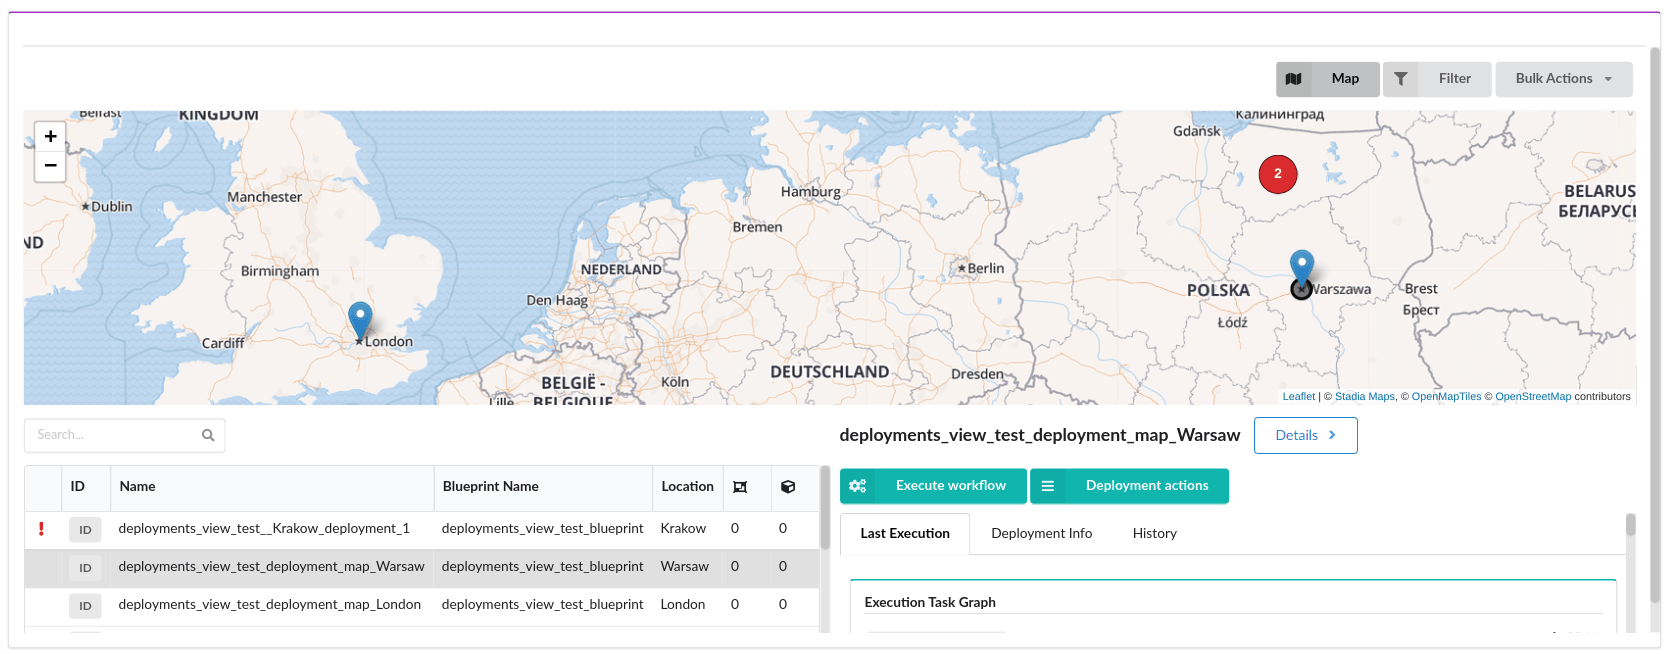
Deployments View
Presents information about deployments in a single view. Contains:
-
a table showing the deployments in the system (the left side)
The deployments can be further filtered. See Filtering deployments.
-
a pane with the deployment details divided into tabs (the right side)
-
a map showing the deployments locations (on the top, opened using the Map button or automatically, if the widget configuration is changed)
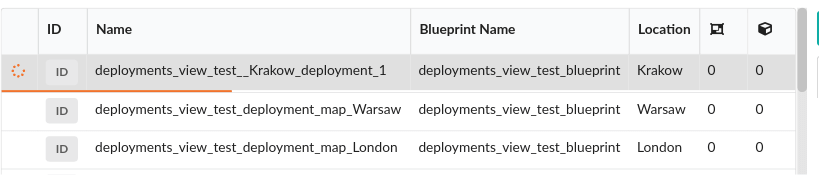
Table
The table shows deployments that match the current filter. See Filtering deployments for more details on filtering.
The columns shown in the table can be shown and hidden using the widget’s configuration.
Clicking a deployment row in the table will select it and affect the contents of the Details pane and the selected marker in the map.
At the bottom of the table are controls that allow changing the number of deployments shown in a single table page, as well as moving to other pages in case there are more deployments that fit a single page.
If there is a workflow in progress for a given environment, there is a progress bar right under the row in the table.
Columns
The columns can show:
-
The deployment status represented as an icon
- No icon - Good
- Yellow spinner
 - In progress
 - Red exclamation mark
 - Requires attention
See the Environments and Services section for more information on deployment statuses.
-
ID - the deployment ID
You can see the exact ID by hovering over the ID button. From the popup you can also copy the ID directly to your clipboard.
-
Name - the deployment display name
-
Blueprint Name - the name of the blueprint that this deployment is using
-
Environment Type - the value of the
csys-env-typelabel for that deploymentUseful for differentiating deployments that use the same blueprint.
-
Location - the name of the site the deployment is assigned to
-
The counts and statuses of child deployments depending on their type (environments or services)
See the Environments and Services section for more information on child deployments.
The counts and statuses in those columns are based on all child deployments (it does not matter whether they are directly or indirectly attached to the main deployment).
-
Deployment labels’ values for selected label key (you can select labels’ keys in widget configuration - “List of labels’ keys to show in the table as columns” parameter)
Sorting deployments
Deployments in the table can be sorted by clicking a column’s header.
Clicking the column again will cycle between ascending and descending sort order.
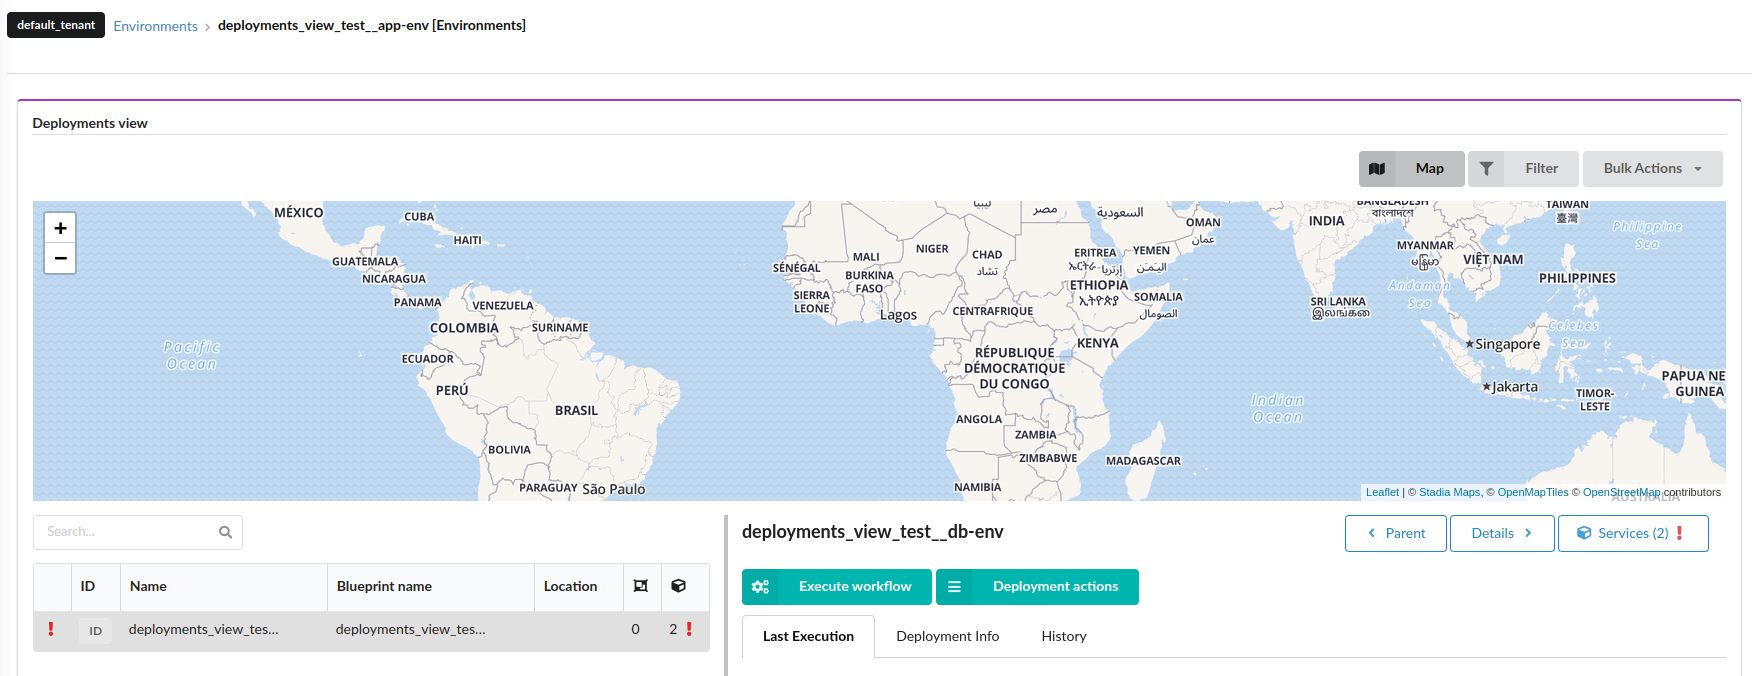
Details pane
The right side of the widget contains details about the currently selected deployment.
In the header of the right side are:
-
the currently selected deployment name
-
button to drill-down to deployment details
-
button to go back to the parent deployment
This button is only visible on child environments and services pages.
-
buttons to drill-down to child environments or services
These buttons are not visible for deployments without child environments or services.
See the Environments and Services section for more information on child deployments.
-
buttons to execute a workflow on that deployment or invoke some other deployment action
What follows are different deployment-related widgets divided into 3 tabs:
- Last Execution - information about the last workflow execution for that deployment
- Deployment Info - general information about the deployment
- History - a list of workflow executions for that deployment and a list of logs
Environments and Services
For clarity and better organization, deployments can form a hierarchical structure and be marked as:
- Environments - can hold other environments and services
- Services - the bottommost level of the hierarchy
Marking the deployments happens by adding the following labels to the deployment:
csys-obj-parent- the ID of the parent of the current deploymentcsys-obj-type- eitherserviceorenvironmentIf there is no such label, the deployment is a service by default.
Forming a hierarchical structure allows drilling down into deployments that are directly attached to a parent environment, as well as aggregating and propagating statuses of deployments for better problem discovery.
Deployment status
A single deployment’s status is:
- Requires attention (red exclamation mark) if one of the following applies:
- at least one node is not successfully installed (and there is no workflow in progress)
- the last workflow execution failed
- In progress (yellow spinner) if there is a workflow in progress
- Good - otherwise.
Propagating deployment statuses
If a deployment has child deployments, then their statuses are propagated so that:
- If there is at least one nested deployment that requires attention, the parent’s status will be Requires attention too.
- Otherwise, if there is at least one nested deployment that is in progress, the parent’s status will be In progress too (unless the parent deployment itself Requires attention).
Drilling down to child deployments
If a deployment has child deployments, the drill-down buttons in the top part of the right pane become visible. Clicking them will navigate to a nested page that present the deployments (only environments or services, depending on the button clicked) from the next level in the hierarchy.
The nested page has only a single Deployments View widget, but it can be customized using the Edit Mode.
Drilling down can happen multiple times if there are more levels in the deployments hierarchy.
To go back to the parent page, use “Parent” button in the Details pane header or the breadcrumbs in top part of the page.
Features
Filtering deployments
Deployments visible in the table can be filtered in 3 ways:
-
Typing in the search bar above the table
-
Setting a default filter in the widget’s configuration
This filter will be persisted and used when viewing the widget again.
-
Applying a local filter
By clicking the “Filter” button in the top-right corner of the widget, one can select a local filter. It will override the default filter picked in the widget’s configuration. The local filter will be reset when viewing the widget again.
The Resource Filter widget does not influence the filtering performed in the Deployments View widget.
Deployments Map
Clicking the Map button in the top part of the widget will open an additional map section in the top part of the widget. The map presents deployments in the sites that are attached to them.
The height of the map section, as well as whether it should be open by default can be changed using the widget’s configuration.
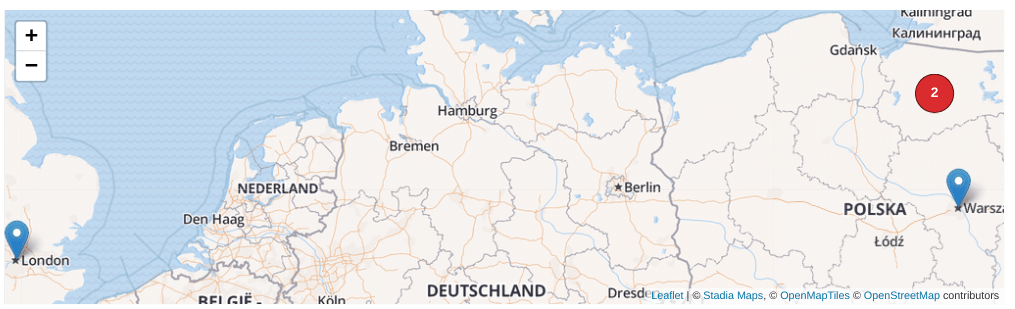
The color of the marker representing a deployment depends on the deployment’s state:
- Blue - Good
- Yellow - In progress
- Red - Requires attention
The map supports zooming (when scrolling using the mouse or when using the zoom buttons in the top-left part of the map) and panning (when dragging using the mouse).
Deployments that are close together are grouped into a cluster that displays the number of deployments in that clustered group. The color of the cluster icon depends on the worst state of deployments inside of it. Clicking the marker will expand the cluster (either by zooming in or by breaking the cluster apart into individual markers).
The currently selected deployment is marked by an additonal circle underneath the marker. Such a deployment is not clustered, meaning it will appear outside of any cluster, even if it is close to other deployments.
Clicking a deployment marker will select it in the table and affect the contents of the Details pane and the selected marker in the map.
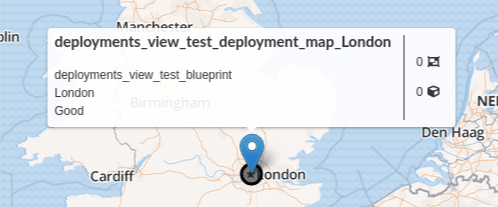
Hovering over a deployment marker will show a tooltip with additonal information:
- Deployment name
- Deployment blueprint name
- Site name
- Deployment status
- The counts and statuses of child deployments
Bulk Actions
The Deployments View widget also has a Bulk Actions button in the top-right corner of the widget. It allows invoking actions over all deployments that match the current filter criteria.
Keep in mind the actions will be invoked also for deployments that are on other pages of the table (not only the deployments that are visible in the current table page).
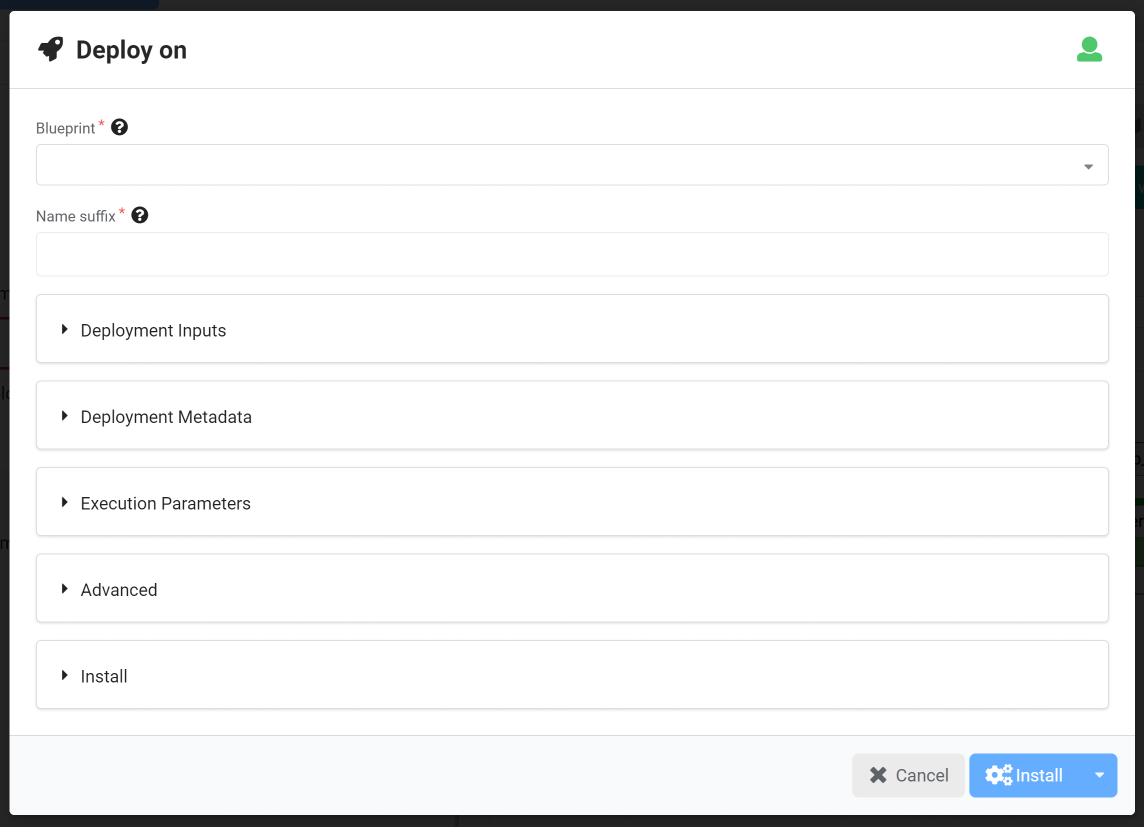
Deploy On
The Deploy On bulk action will show a modal that guides the user through deploying additional services on the environments that are matched by the current filter.
After selecting the base blueprint for the new deployments, providing a name suffix and additional labels, there will be a new child deployment created for each deployment matched by the current filter. Each generated deployment will be labeled with the Environment ID of the environment on which it is deployed as a parent label, and the capabilities of that parent environment can be retrieved using the get-environment-capability intrinsic function.
The newly created child deployments will be automatically installed.
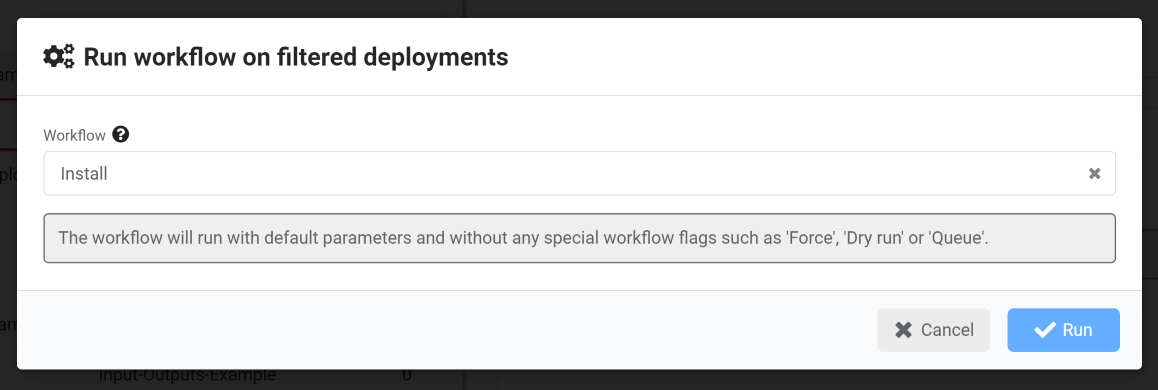
Run Workflow
The Run Workflow bulk action will show a modal that allows selecting a workflow that will be executed on each deployment that matches the current filter.
Settings
-
Refresh time interval- The time interval in which the widget’s data will be refreshed, in seconds. Default: 10 seconds -
Map height- the height of the map section in pixels -
List of fields to show in the table -
List of labels' keys to show in the table as columns -
Number of items to show at once in the table -
Show map by default -
Name of the saved filter to apply- the name of a filter to use by default when there is no local filter applied.See Filtering deployments for more information.
-
Filter by parent deployment- whether to only show deployments that are directly attached to a deployment selected on a previous, parent page.This is useful only when manually adding the Deployments View widget inside of a drilled-down page.