Deployment Metric Graph
Displays a chart or charts (up to 5) presenting metric of data collected by using a monitoring plugin in a specific deployment. If when installing Cloudify Manager, influxDB was also installed on the manager, the widgets will read the data from it. Otherwise, an external endpoint for influxDB can be set in the UI’s configurations. You can select the metrics to be displayed in the widget, and define their properties in the widget’s configuration dialog, as long as this data is indeed being collected for the deployments.
In Cloudify examples, the monitoring is implemented using the Diamond plugin, and the data is being collected to InfluxDB which is installed on the Manager.
You must supply at least one metric or database query in the widget configuration, and choose the specific node instance you want to present the data of.
You must also provide the Blueprint, Deployment, Node and Node instance IDs, either in the page context or in the widget configuration.
Widget Settings
Refresh Time Interval- The time interval in which the widget’s data will be refreshed, in seconds. Default : 5 secondsNode filter- Use this filter to choose the node instances you want to present the data of. Make sure this are node for which data is indeed collected. You can set Deployment ID and Node instance ID in page context with the Resource Filter
Charts Table- Table containing definition of up to 5 charts.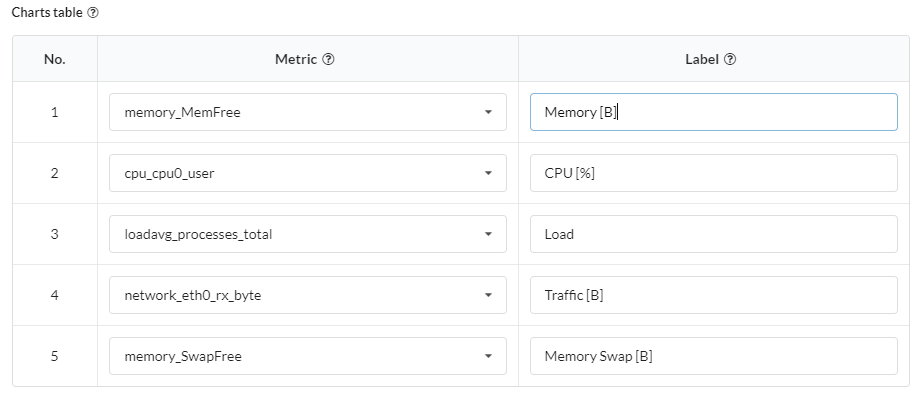
You can define the following parameters:
Metric- The specific Diamond metric you want the widget to display. This parameter is mandatory. For more information about these metrics, see the Diamond documentation. The available options are dynamically fetched from InfluxDB filtered byNode filterparameter.Label- The label to be displayed for the specific chart (the label will be displayed at the bottom of the chart). Parameter is optional. When not specified, then metric name will be taken as chart label.
Time range and resolution- Enables you to specify the timeframe of the metrics to be displayed. For details of the configuration see Time filter widget.Custom Influx Query- By default, the query is based on deployment ID, metric name, time filter and resolution. It is possible to define your own query, which will then be used to fetch data.
Query (
select <SELECT column> from <FROM column> where <WHERE column>) consists of the following parameters:SELECT- Defines part of query added just after SELECT keyword. Example:mean(value)FROM- Defines table from which to fetch data, you can use${deploymentId},${nodeId}and${nodeInstanceId}tokens to inject dynamic values of appropriate identifiers. Example:/${deploymentId}..*${nodeInstanceId}.((memory_MemFree))$/WHERE- Defines constraints for the query. You can use${timeFilter}token to inject dynamic data/time ranges. Example:time > now()-1h and time <now() group by time(1m) order ascor just${timeFilter}.
Charts Type- Select one of the following types: line, bar and are chart display.
Examples
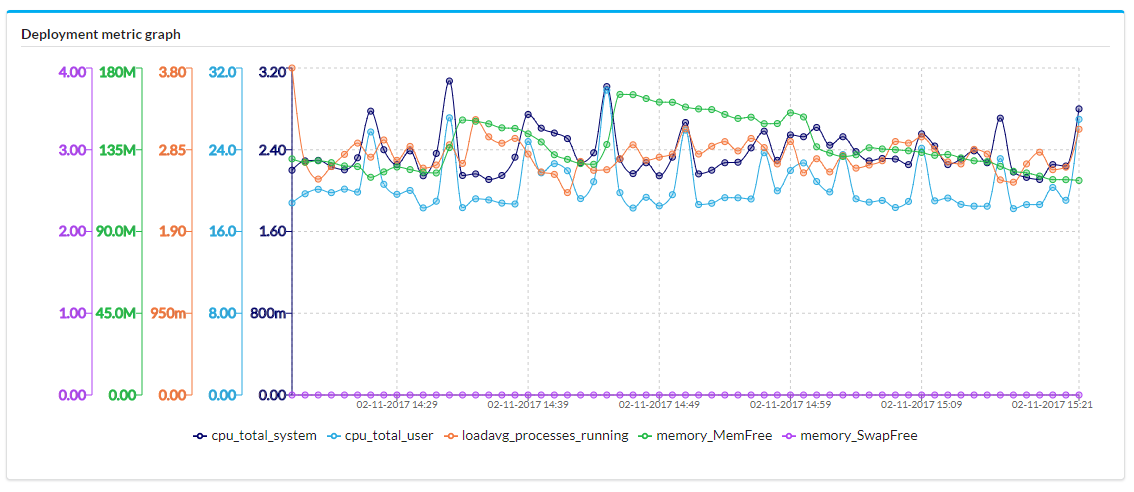
- multi-metric with line charts
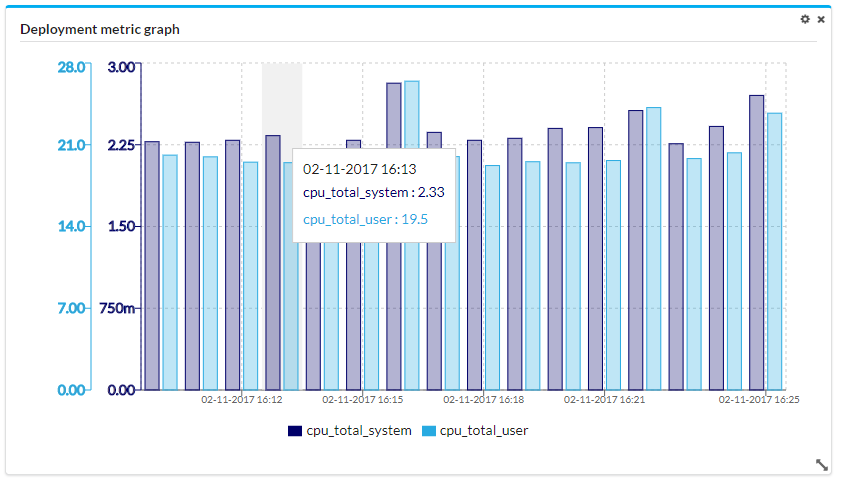
- multi-metric with bar charts
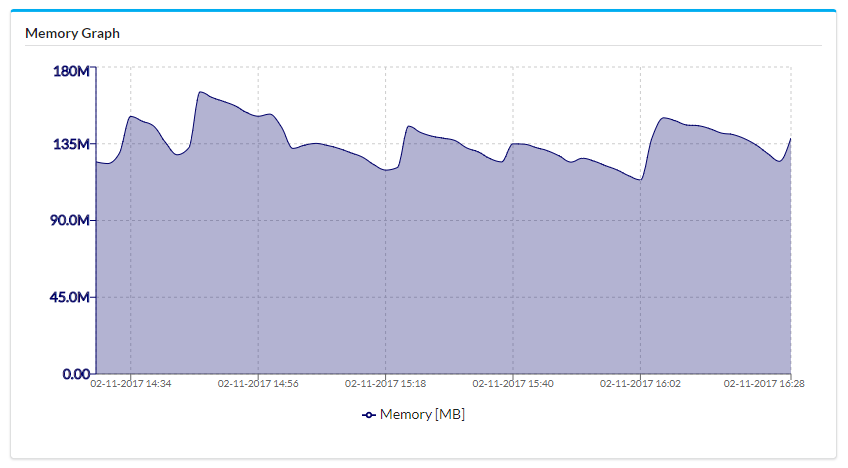
- single-metric with area chart