Statistics Page
Statistics page displays tools allowing to monitor your deployments by visualizing collected system measurements.
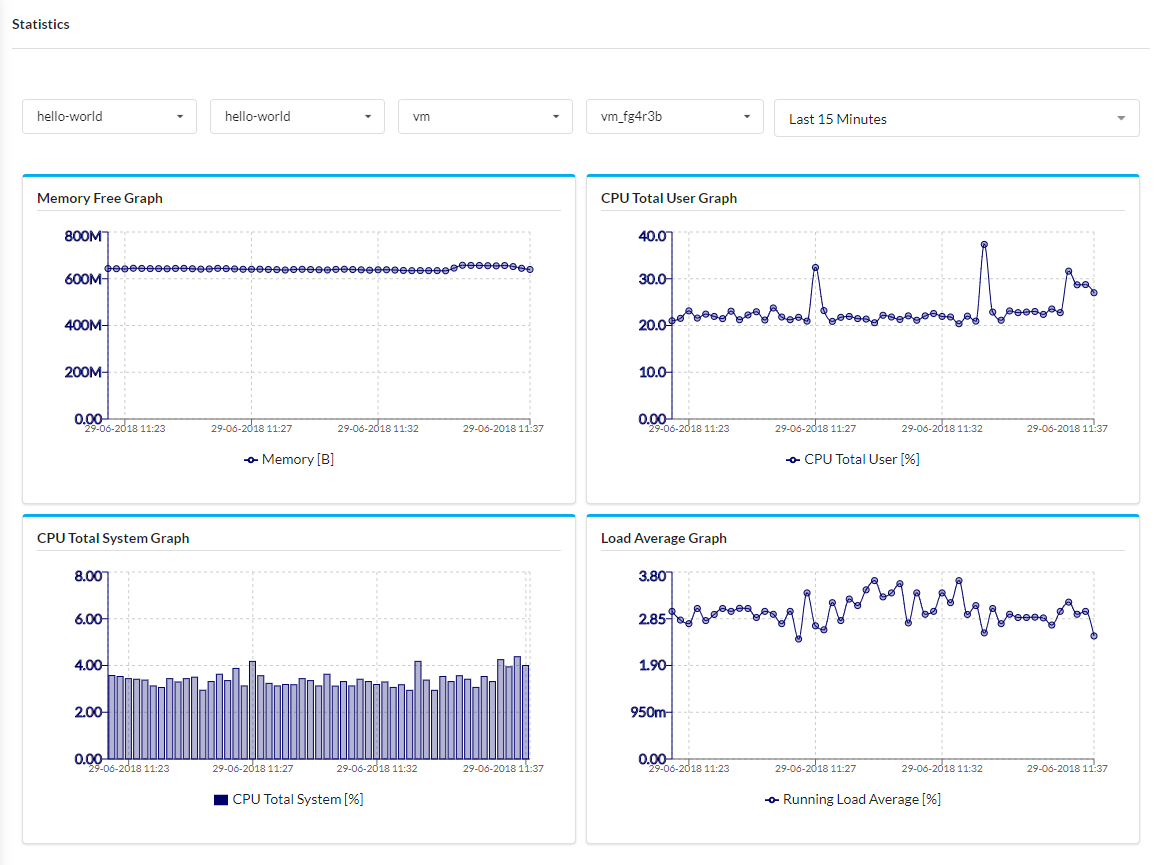
Page contains Resource and Time Filter widgets and four Metric Graphs widgets with predefined metrics.
Resource Filter
Resource Filter widget allows you to select specific node instance for monitoring. You can filter by blueprints, deployments and nodes to limit the list of node instances.
More about Resource Filter widget you can find here.
Time Filter
Time Filter widget allows you to define time range for all the graphs displayed on the page.
For more about what you can achieve with Time Filter widget see here.
Metric Graphs
There are 4 Deployment Metric Graph widgets on the page. They display value changes in time of the following metrics:
- Memory Free
- CPU Total User
- CPU Total System
- Load Average
By changing widget’s configuration you can visualize another metrics.
To learn how to do it see here.