Events and Logs
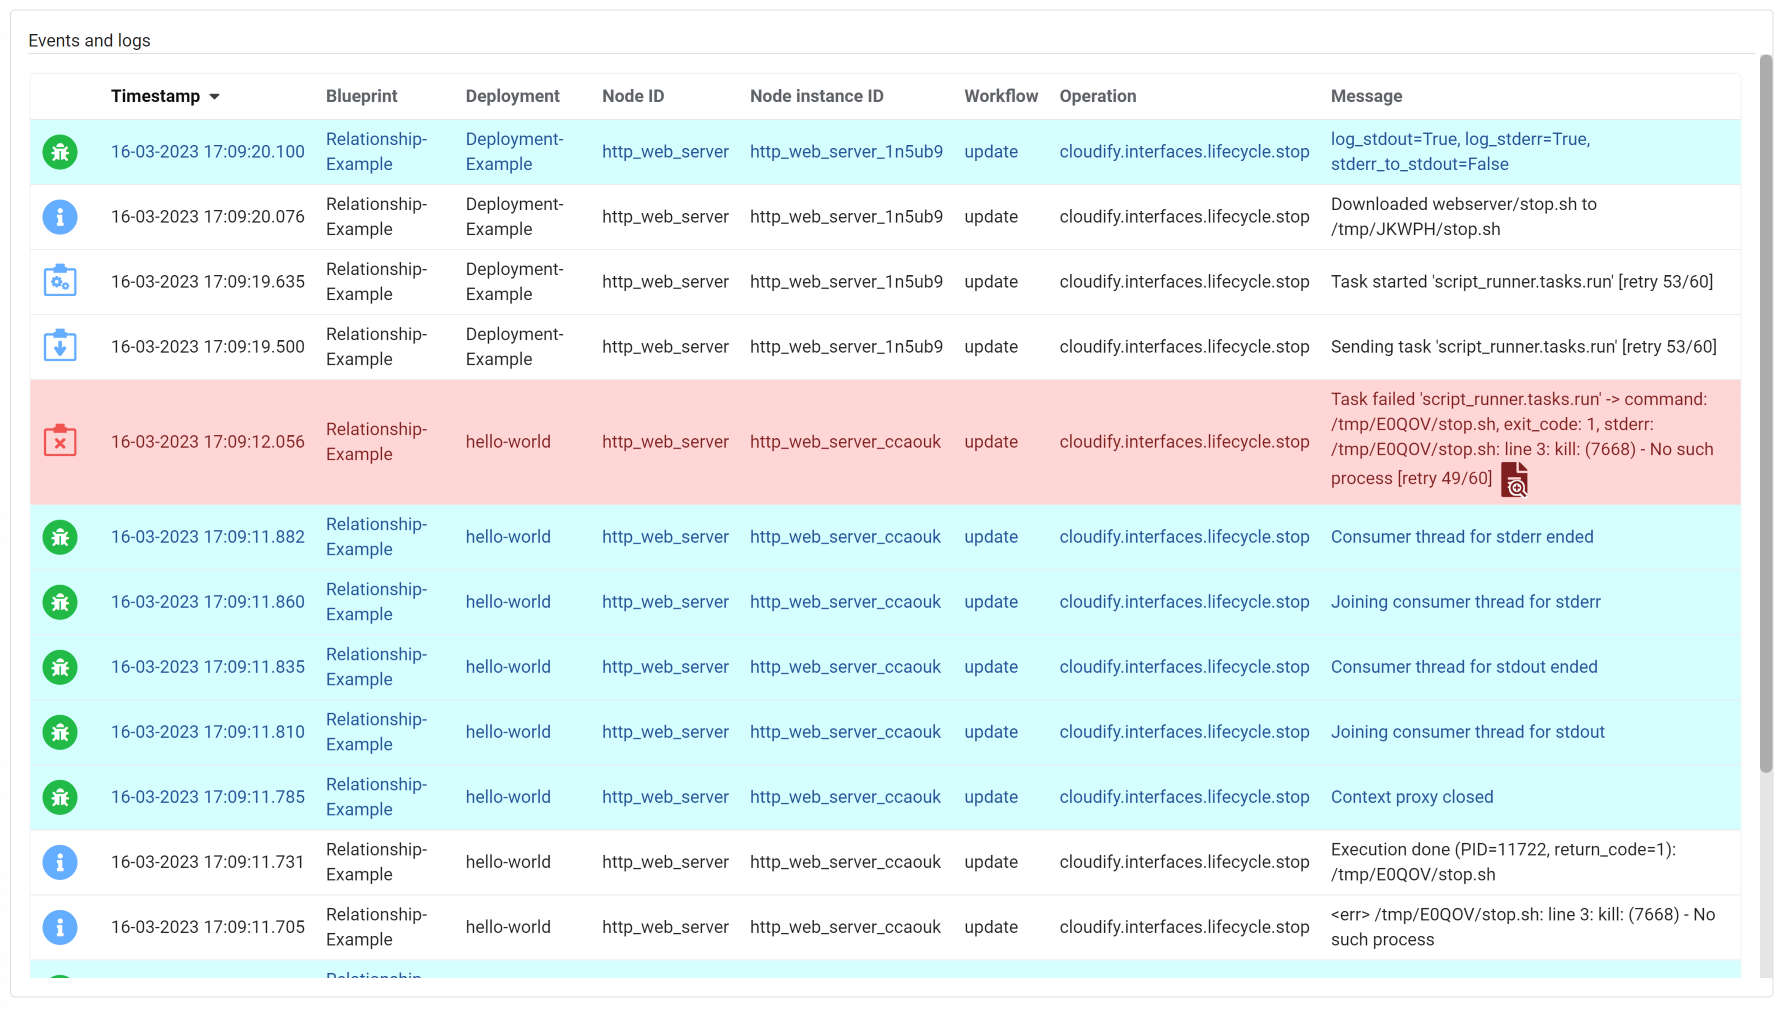
Displays the logs and events of all the executions in the current tenant, according to the user’s permissions.
You can configure the fields that are displayed and can choose to indicate in colors success and failure messages.
You can sort events/logs by Timestamp (default), Blueprint, Deployment, Node ID, Node instance ID, Workflow, Operation and Type.

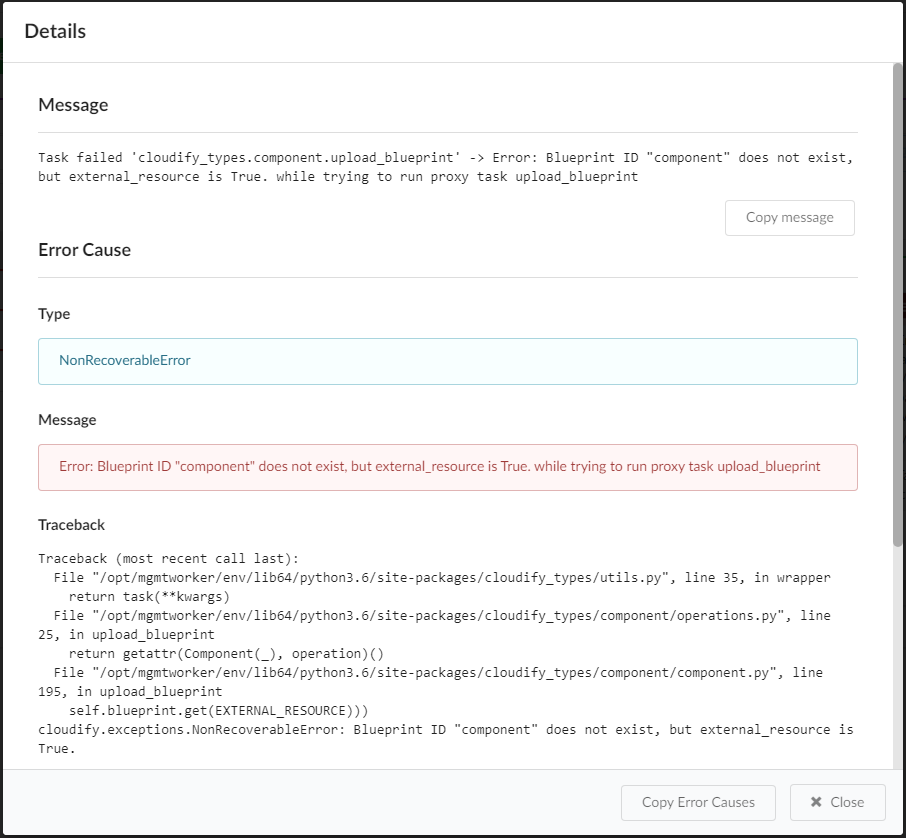
Sometimes error logs may contain additional information about error cause or the event/log message is truncated (see Maximum message length before truncation setting below). This will be indicated by ![]() icon in the Message column. When you click on this icon you will see full message and error causes, if any:
icon in the Message column. When you click on this icon you will see full message and error causes, if any:

Settings
-
Refresh time interval- The time interval in which the widget’s data will be refreshed, in seconds. Default: 2 seconds -
List of fields to show in the table- You can choose which fields to present. By default, these are the fields presented:- Icon
- Timestamp
- Blueprint
- Deployment
- Node ID
- Node instance ID
- Workflow
- Operation
- Message
You can also choose to add the field “Type”, which will present the log level in case of a log, and event type in case of an event.
-
Color message based on type- when marked as “on”, successful events will be coloured in blue, and failures in red. Default: On -
Maximum message length before truncation- Allow to define the length of the messages presented in the table. Default: 200. Please note that even if the message is being truncated in the table itself, you can see the full message after clicking the details icon.
