Executions
Displays data about the executions in the current tenant, according to the user’s permissions.
Features
Executions list
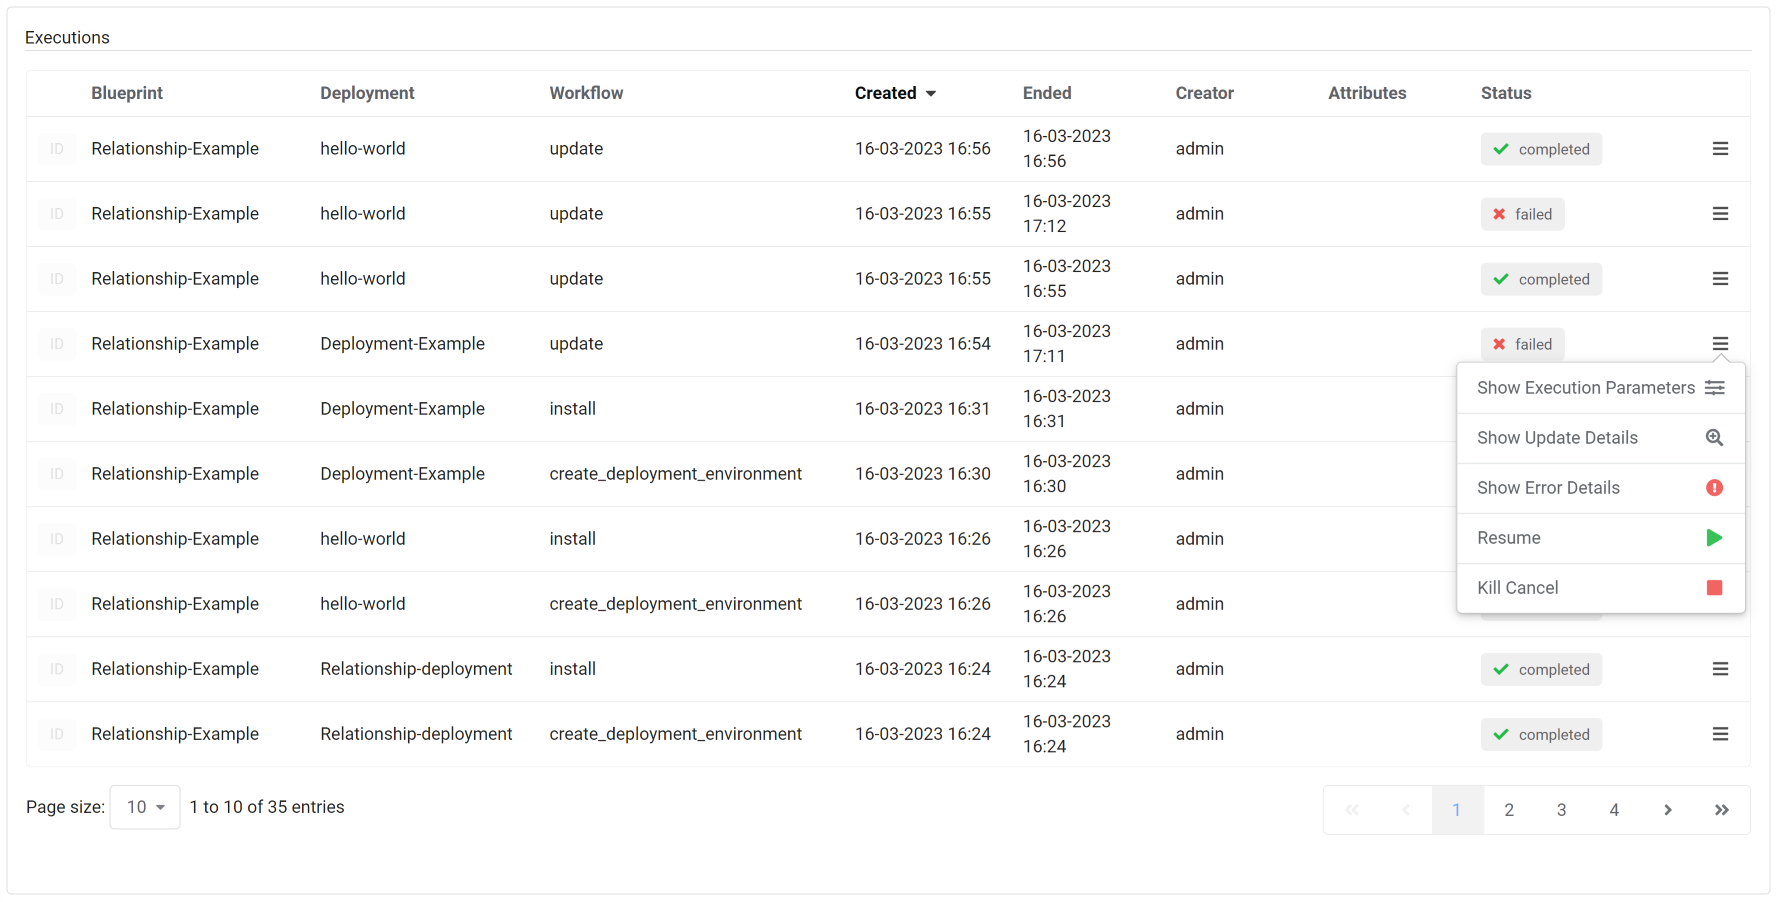
By default, the presented details include the blueprint and deployment of the execution, name of the workflow, the time that it was created and ended, execution creator, execution attributes, its status and actions menu.

Attributes
In Attributes column you can see one of these icons:
Actions
In the actions menu on the right side of the execution row (click ![]() to open) you can perform additional actions on the execution:
to open) you can perform additional actions on the execution:
Show Execution Parameters- shows details in modal window about execution parameters,Show Update Details- shows details in modal window about blueprint and inputs change (available only for ‘update’ executions),Show Error Details- shows error details in modal window (available only for failed executions),Resume- resume the execution (available only for cancelled or failed executions)Cancel- cancels the execution (available only for active executions),Force Cancel- enforces cancellation of the execution (available only for active executions),Kill Cancel- the process executing the workflow is forcefully stopped, even if it is stuck or unresponsive.
For details about cancelling executions, see cancelling workflow executions
Execution task graph
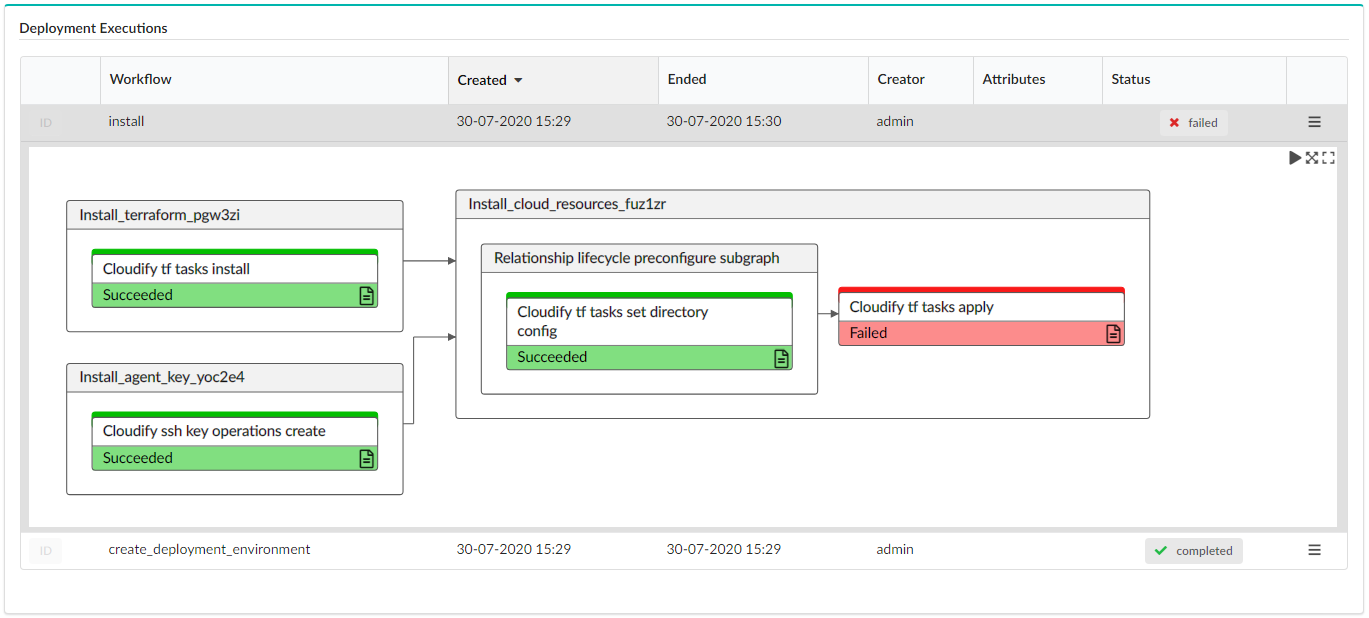
Workflow defines tasks that can be executed on a node or a group of nodes. Most workflows are implemented with a tasks graph. When the workflow is being executed, the state of the tasks graph, and each operation in it, is persisted to storage. When the workflow is resumed, the tasks graph is reconstructed, and the execution continues.
See Workflow Execution Model for deeper understanding of how executions and task graphs are designed.
Visualization modes
Visualization of the workflow execution task graph can be displayed in Executions widget in two ways depending on Show most recent execution only parameter value (see Settings for details):
Off - default view (Executions list) - after selecting an execution by clicking its row in the table a corresponding task graph is displayed

On - single execution view - the last execution for the selected deployment is displayed

Task state
Each graph node represents a task that is part of the execution. Each node is colored depending on task state:
- White - pending
- Yellow - executing
- Green - completed
- Red - failed
Actions
In the upper right corner you can see a toolbar:

By clicking icons from the toolbar you can:
- Enter Play mode in which the view tracks the progress by following tasks in progress
- Fit to view to display entire graph inside widget borders
- Open in window to display graph in modal view with miniature view for extremely large workflows
A task node may contain an icon in the bottom right corner:

It allows you to automatically set an operation in Events/Log Filter widget related to that task and filter logs in Events/Logs widget to display only those which are relevant for the selected task.
Settings
Refresh time interval- The time interval in which the widget’s data will be refreshed, in seconds. Default: 5 secondsList of fields to show in the tableYou can choose which fields to present. By default, these are the fields presented:- Blueprint
- Deployment
- Workflow
- Created
- Ended
- Creator
- Attributes
- Status
- Actions
You can also choose to add
Idcolumn from the list, which will present the execution id. By default this value is not presented as a column in the table, but as a pop up shown by hovering over ID label.Show system executions- allow to include or exclude executions of system workflows in the list. Default: OnShow most recent execution only- if enabled the widget only shows a tasks graph for the most recent execution. Default: Off
