Default Widgets Reference
This section provides a description of all the widgets that are included by default in Cloudify Manager (out-of-the-box). You can select these widgets from the widgets catalog.
To view the widgets catalog, from the dropdown menu next to your user name, select Edit Mode, then click the Add Widget button to display the list of widgets. If you do not see Edit mode in the dropdown menu, you do not have permissions to edit configuration.
For information about adding widgets, placing them on a page, and so on, see Configuring the Cloudify Console Display.
Notes:
- You might have to configure some of the widgets. In the event that configuration is mandatory, the mandatory requirements are included in the widget descriptions. Many widgets also have non-mandatory configuration that enables you to customize them to your requirements.
To open a widget’s configuration dialog after you have added it to a page, click the gear icon in the top right of the widget.
- Some widgets are only available for
adminusers.
The widgets are listed according to their category.
- Blueprint Widgets
- Deployment Widgets
- Events and Logs Widgets
- Execution Widgets
- Filter Widgets
- Cluster Widgets
- Node Widgets
- Miscellaneous Widgets
- Button Widgets
Blueprint Widgets
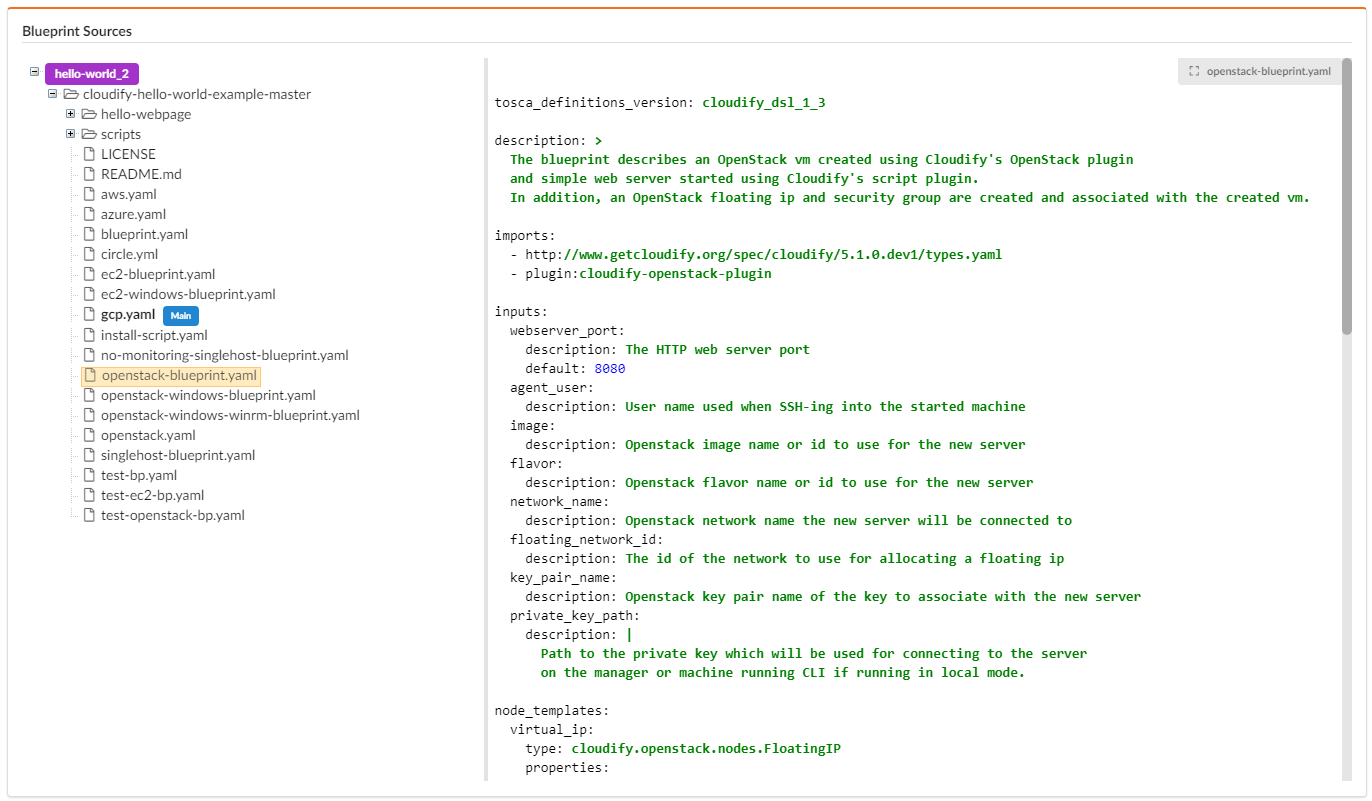
Blueprint Sources
Displays all the sources in a blueprint package in tree view, adjacent to the code. When you click an item in the tree, its code is displayed in the code panel.
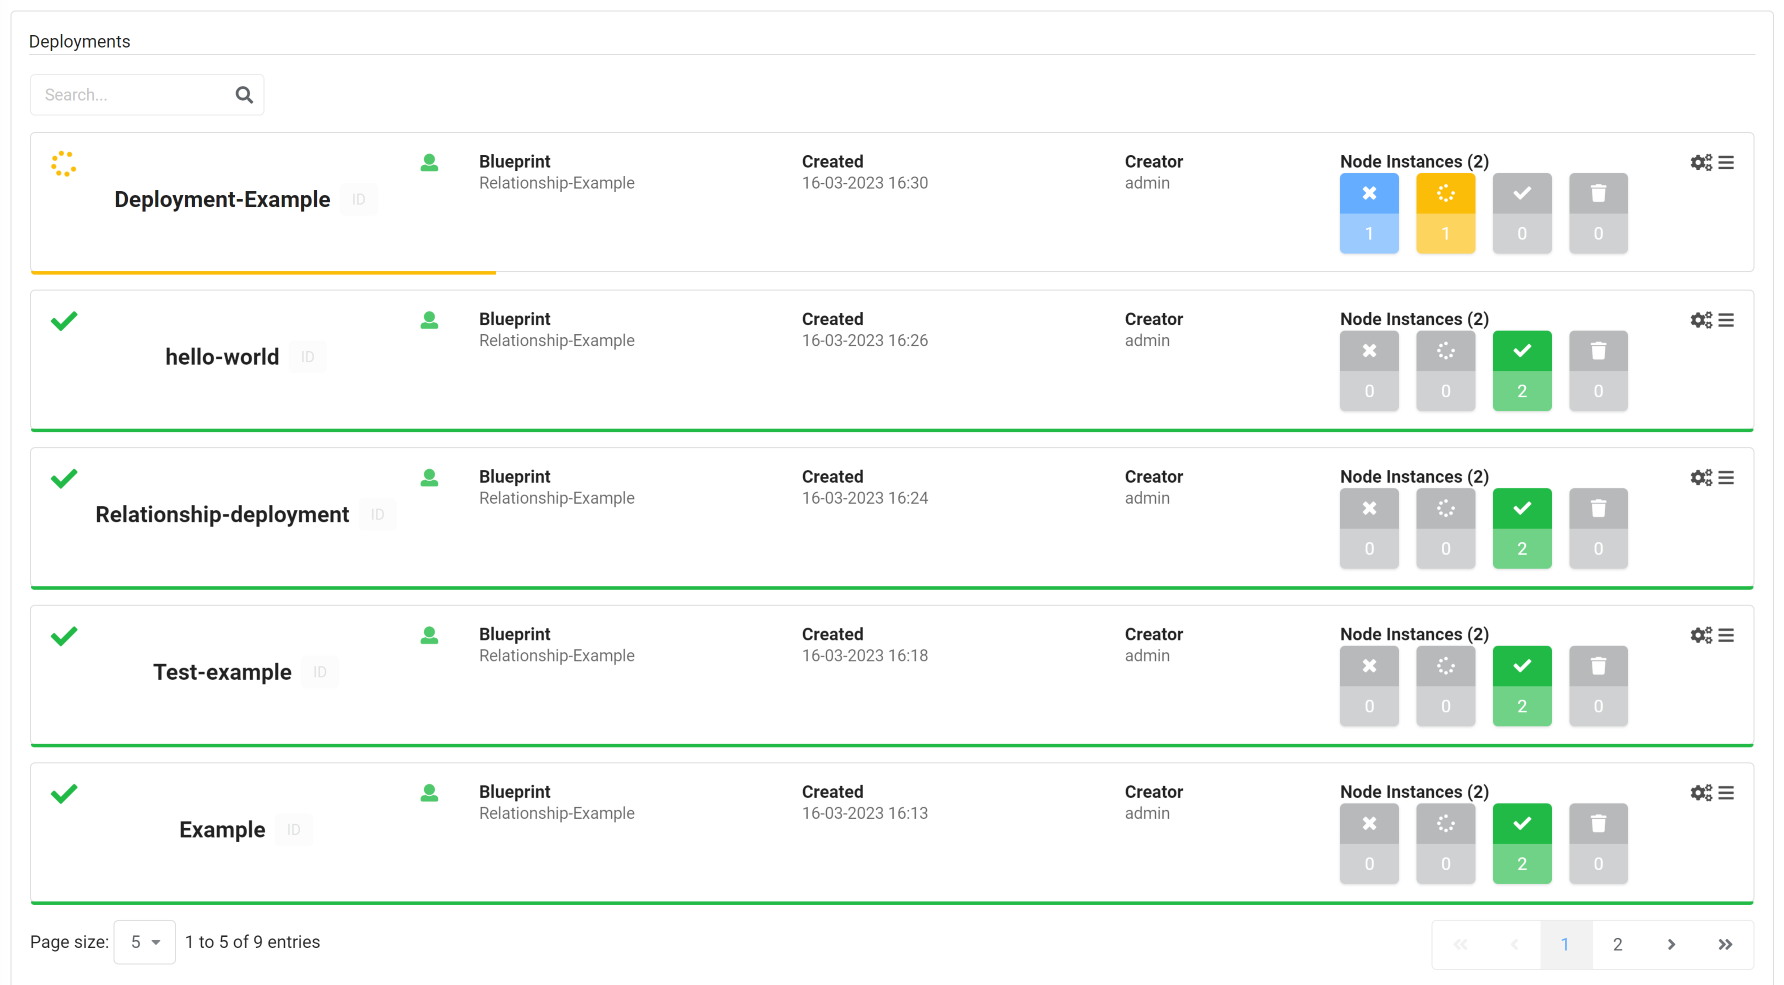
Blueprint deployments
Displays the list of a deployments in the current tenant, according to the logged-in user’s permissions. The data can be displayed as a table or list. In the case of a list view, the status of each deployment is also displayed. For information about deployment status, click here
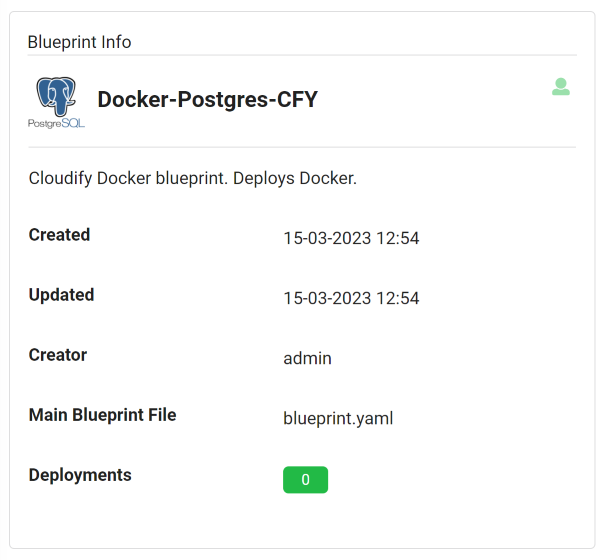
Blueprint info
Displays information about a specific blueprint.
Configuration
The blueprint ID must be passed to the widget. This can be done either in the page’s context, by placing the widget in a blueprint drill-down page, or by specifying the blueprint ID in the widget’s configuration.
Blueprints
Displays all the local blueprints on the Cloudify Manager in the context of the current tenant as a table or tile view, according to the logged-in user’s permissions. In the catalog view, each blueprint entry includes the icon PNG file with which it was uploaded or the Cloudify default icon if no PNG file was attached.
Configuration
In the widget configuration dialog, you can toggle on the Enable click to drill down option so that, when the blueprint is clicked, the drill down page is displayed for that blueprint.

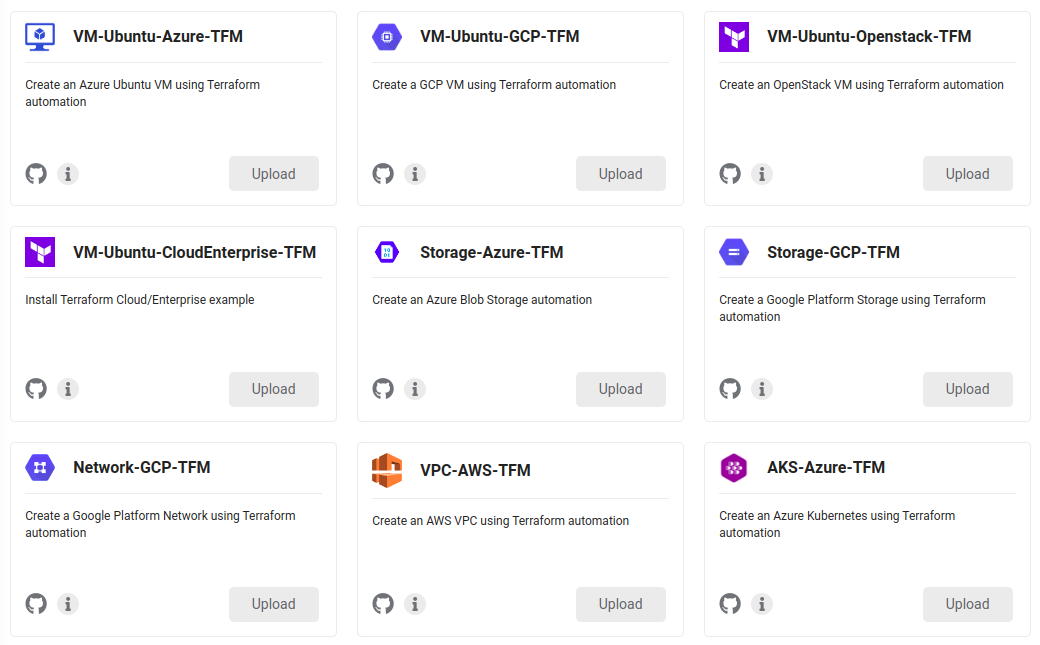
Blueprints Catalog
Displays blueprints (as a table or tile view) that exist in a repository under a Github account.
Configuration
You must specify the name of the user account in the widget’s settings. The widget includes an upload option for each of the blueprints, which lets you easily upload to the manager.
You can create a filter query in the configuration to specify the blueprints that appear.
You can also enter a Github credentials to let you fetch data. These parameters are pulled from secrets) as the github-username and github-password keys. You must enter those secrets to access private repositories.
Deployment Widgets
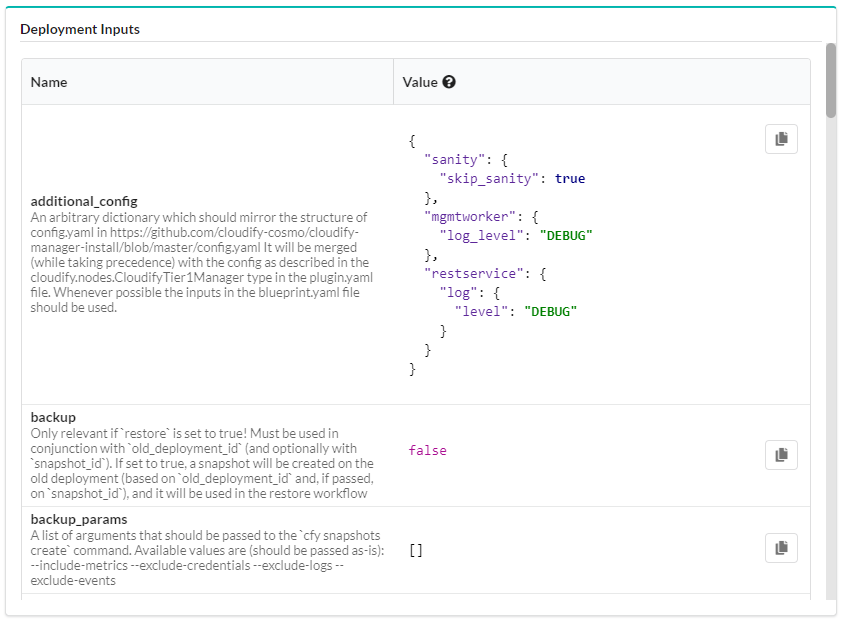
Deployment Inputs
Displays the blueprint input values. You can hover over the values, to display them in a separate window, which is useful if the values include multi-line code.
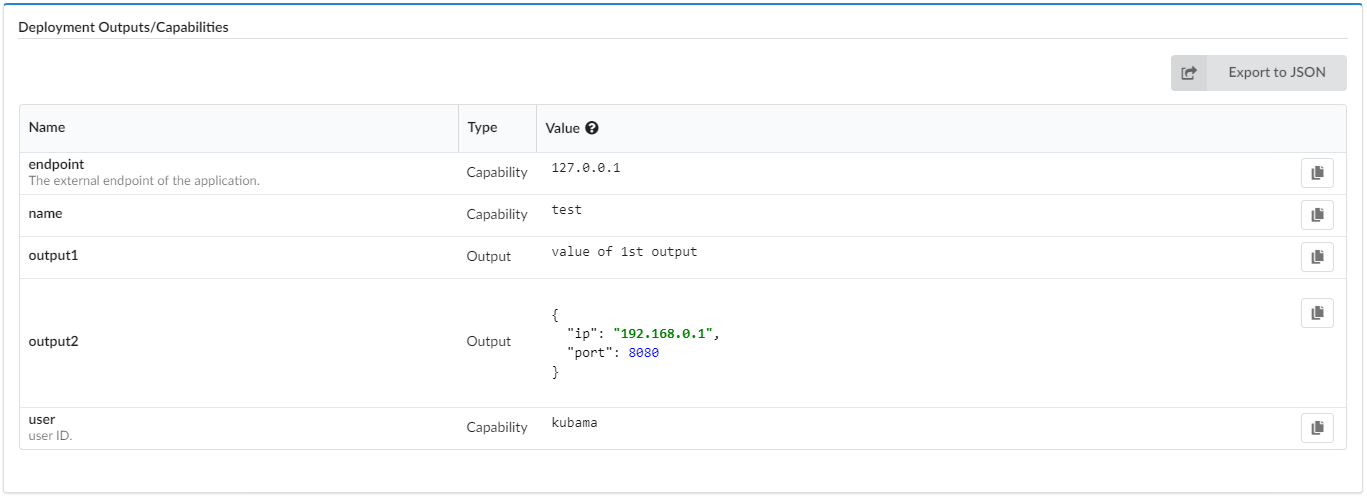
Deployment Outputs
Displays the blueprint output values. You can hover over the values, to display them in a separate window, which is useful if the values include multi-line code.
Deployment Metric Graph
Displays a chart or charts (up to 5) presenting metric data for the current deployment. After you have added the widget to a page, you can select the metrics to be displayed, and define their properties in the widget’s configuration dialog.
Configuration
You must supply at least one metric or database query in the widget configuration. You also must enter the Deployment ID and Node instance ID, either in the page context or in the widget configuration.
The following list provides information regarding parameters that can be specified for this widget.
Refresh Time Interval- How frequently the data in the widget is refreshed (in secs).Node filter- Show only data for the specified nodes. Deployment ID and Node Instance ID must be set in the configuration or as part of the page context. You can set Deployment ID and Node instance ID in page context with the Resource Filter
Charts Table- Table containing definition of up to 5 charts. You can define the following parameters:
Metric- The specific Diamond metric you want the widget to display. This parameter is mandatory. For more information about these metrics, see the Diamond documentation. The available options are dynamically fetched from InfluxDB filtered byNode filterparameter.Label- The label to be displayed for the specific chart (the label will be displayed at the bottom of the chart). Parameter is optional. When not specified, then metric name will be taken as chart label.
Time range and resolution- Enables you to specify the timeframe of the metrics to be displayed. For details of the configuration see Time filter widget.Custom Influx Query- By default, the query is based on deployment ID, metric name, time filter and resolution. It is possible to define your own query, which will then be used to fetch data. Query (
select <SELECT column> from <FROM column> where <WHERE column>) consists of the following parameters:SELECT- Defines part of query added just after SELECT keyword. Example:mean(value)FROM- Defines table from which to fetch data, you can use${deploymentId},${nodeId}and${nodeInstanceId}tokens to inject dynamic values of appropriate identifiers. Example:/${deploymentId}..*${nodeInstanceId}.((memory_MemFree))$/WHERE- Defines constraints for the query. You can use${timeFilter}token to inject dynamic data/time ranges. Example:time > now()-1h and time <now() group by time(1m) order ascor just${timeFilter}.
Charts Type- Select one of the following types: line, bar and are chart display.
Examples
multi-metric with line charts

multi-metric with bar charts

single-metric with area chart

Events and Logs Widgets
Events and Logs
Displays the logs and events of all the executions in the current tenant, according to the user’s permissions. You can configure the fields that are displayed and can use colors to indicate success and failure messages.
Configuration
The fields that can be displayed are:
- Icon
- Timestamp
- Type
- Blueprint
- Deployment
- Workflow
- Operation
- Node Name
- Node ID
- Message

Event and Logs Filter
Displays a filter pane for events and logs.

Execution Widgets
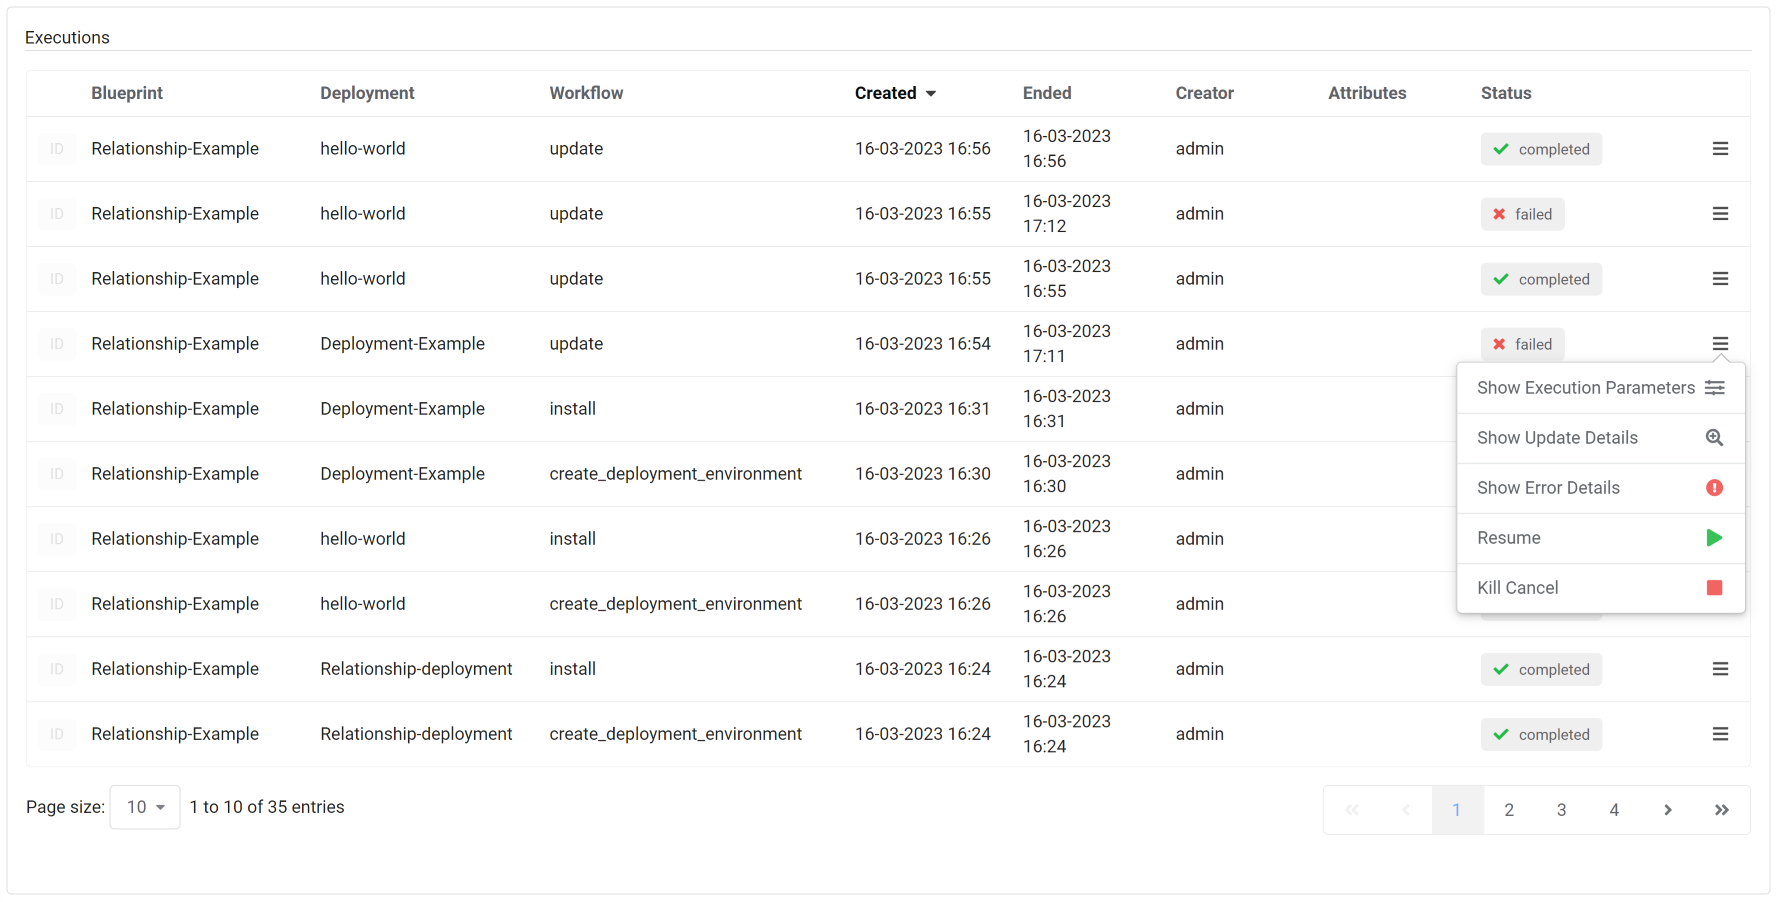
Executions
Displays data for about the executions in the current tenant, according to the user’s permissions. Data includes the blueprint and deployment of the execution, the time that it was created, and its current status.
Filter Widgets
Resource Filter
Displays a filter to enable searching by blueprint, deployment, node, node instance or execution.

Configuration
Blueprints and deployments filters are always enabled. Node, node instance and execution filters are optional and can be enabled/disabled in widget’s configuration.

Event and Logs Filter
Time Filter
Displays a time filter for deployment metric graphs. It allows to define:
Time range - Enables you to choose start (
From) and end (To) dates- by defining custom range
- using text input - Influx-compatible date/time is allowed. It is possible to define both absolute and relative date/time. For details, see the Influx documentation - Date time strings. Examples:
now() - 15mor2017-09-21 10:10 - using calendar picker - You can choose date and time from the calendar/time pickers
- using text input - Influx-compatible date/time is allowed. It is possible to define both absolute and relative date/time. For details, see the Influx documentation - Date time strings. Examples:
- by choosing predefined range - There are few predefined time ranges available. You can apply them with one click using the buttons on the left side of the filter
- by defining custom range
Time resolution - Enables you to group the metrics according to time, to reduce the volume of displayed data. For example, although data might be collected every 10 msecs, you might specify that you only see points on the graph for every minute. Allowed time resolution units:
microseconds,milliseconds,seconds,minutes,hours,daysandweeks. Value ranges from 1 to 1000.
The filter provides also the following features:
Time resolution optimization - Automatic time resolution is set when you specify predefined range. It optimizes number of points to fetch from database to maximum 200 per chart. You can also optimize time resolution for custom ranges by clicking
Optimizebutton.Time range and resolution reset - When you click
Resetbutton, both time range and time resolution are reset to default values.Data validation - When you click
Applybutton time range is validated. If invalid data is provided, then appropriate input field is marked with red color and time filter window will not be closed.

Cluster Widgets
High Availability
Displays the Manager’s status. In the event that there is one or more cluster on the Manager, shows the cluster-connected nodes. There is no click-through actions available from this widget.

Node Widgets
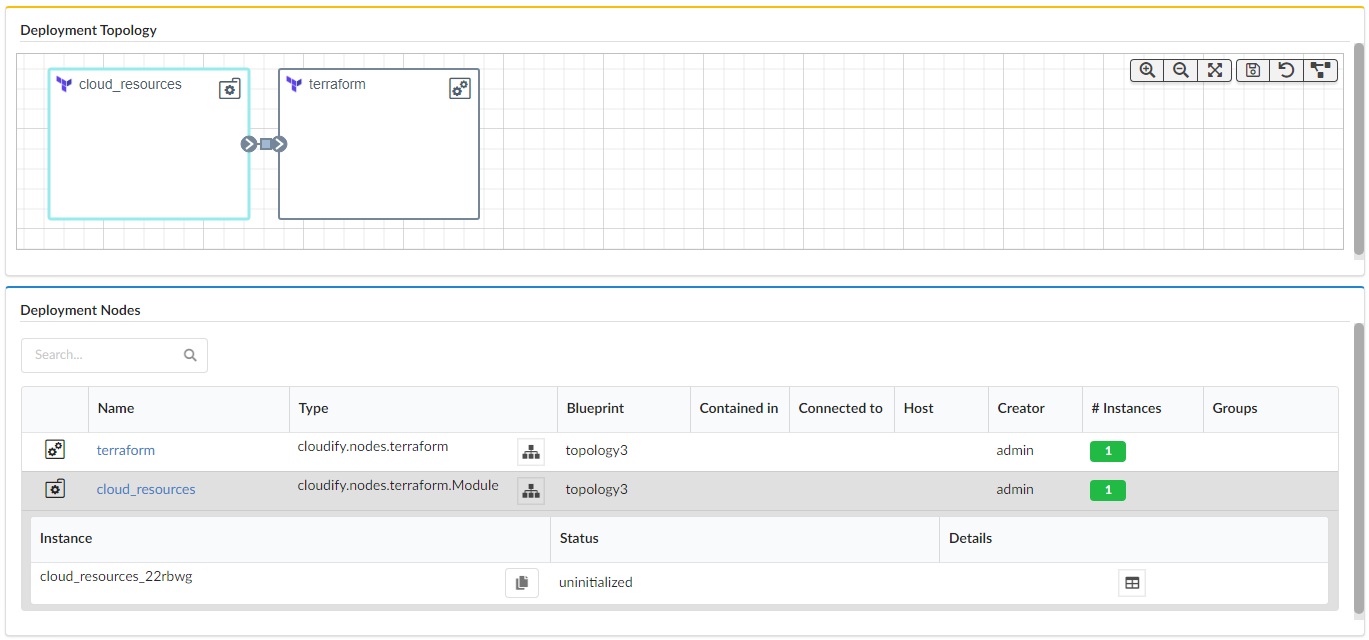
Nodes List
Displays a list of the existing nodes related to the blueprint topology. The type, containing node, connection, number of instances, and groups of which the node is part are displayed.
The nodes are listed by name. When you select a node, either by clicking its name in the table or by clicking it in the Topology pane, additional data about the node’s instances are displayed.
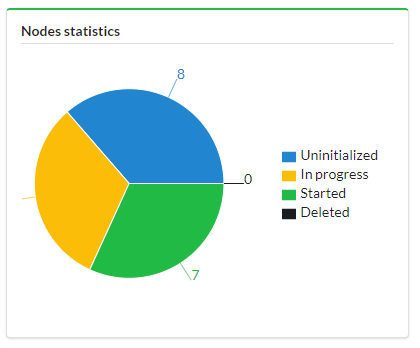
Nodes Statistics
Displays the number of node instances, according to their states.
Miscellaneous Widgets
Number of Deployments/Plugins/Servers
Displays indicators that provide the total number of deployments, plugins and servers on the Manager.

Plugins List
Displays a list of plugins and enables their management.

Secrets Store Management
Displays a list of secrets and enables their management. In the widget, you can hover your cursor over the eye icon to display the value of the secret.
Any user who has access to the Secrets Store Management widget can view the value of the secrets.

Snapshots List
Displays a list of snapshots of the Manager. This widget is only available to admin users.

The parameters shown in the screenshot below can be specified during snapshot creation.

When you restore snapshots, use the process for either your existing VM or a new VM.
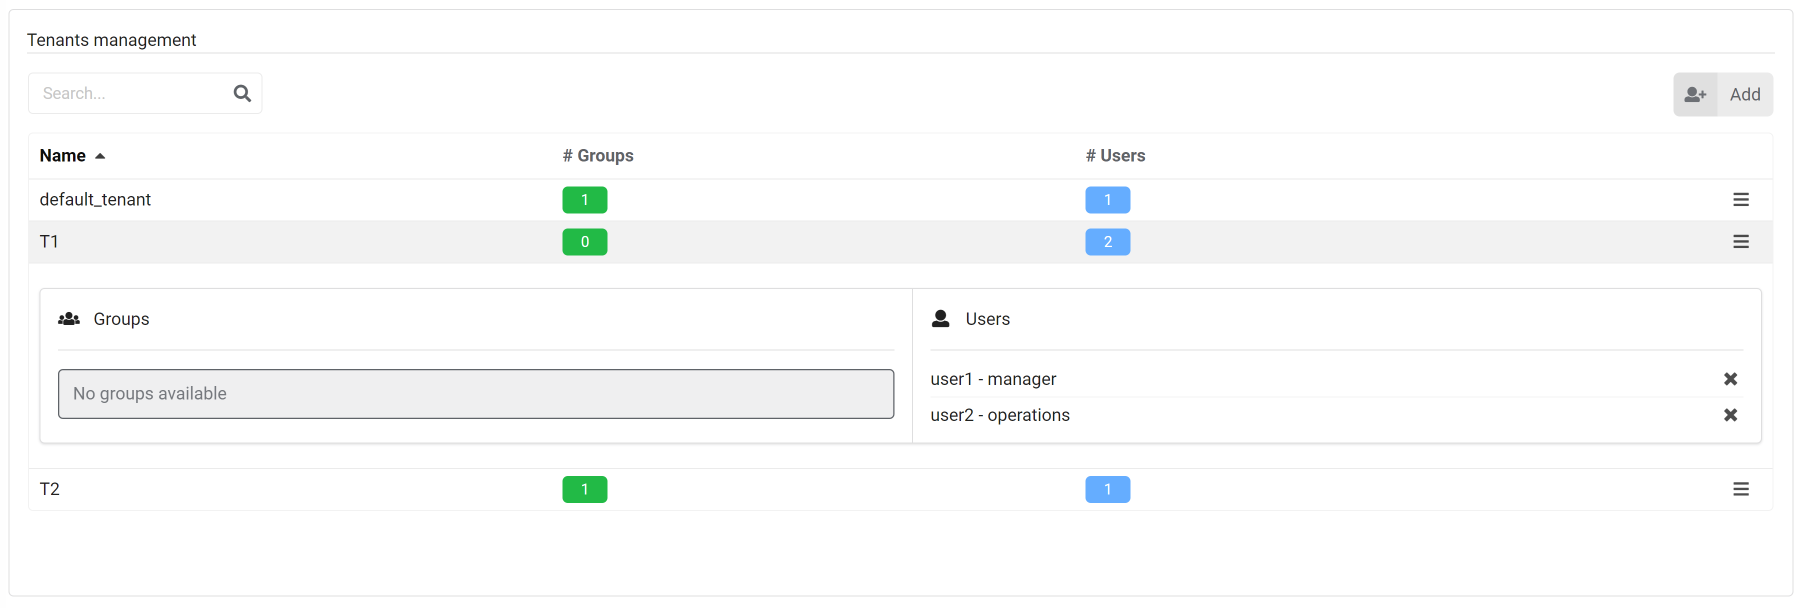
Tenant Management
Displays a list of tenants on the Manager and enables tenant management. This widget is only available to admin users.
User Group Management
Displays the list of user groups and enables their management. This widget is only available to admin users.

User Management
Displays the list of users and enables their management. This widget is only available to admin users.

Show Topology
Displays the topology of a blueprint or deployment.

When executing a Workflow for a Deployment (e.g. the install workflow), the topology nodes show badges that reflect the workflow execution state.
See more details on executing workflows here.
Badges
- Install state - The workflow execution is in progress for this node
- Done state - The workflow execution was completed successfully for this node
- Alerts state - The workflow execution was partially completed for this node
- Failed state - The workflow execution failed for this node

Workflow states represented by badges
A deployment before any workflow was executed

A deployment with a workflow execution in progress

A deployment with a workflow execution in progress, partially completed

A deployment with a workflow execution completed successfully

A deployment with a workflow execution partially completed successfully with some alerts

A deployment with a workflow execution that partially failed

A deployment with a workflow execution that failed

Button Widgets
Blueprint action buttons
Displays buttons for displaying the creating a deployment or deleting a blueprint dialog.

Button Link
Opens the specified URL in a separate tab. You can define the name that appears on the button.
Configuration
Specify the URL to open when the button is clicked and buttons label.

Deployment Action Buttons
Displays buttons for displaying the execute a workflow, update a deployment, and delete a deployment dialogs.

New Deployment Button
Displays a button for displaying the creating a deployment dialog.

