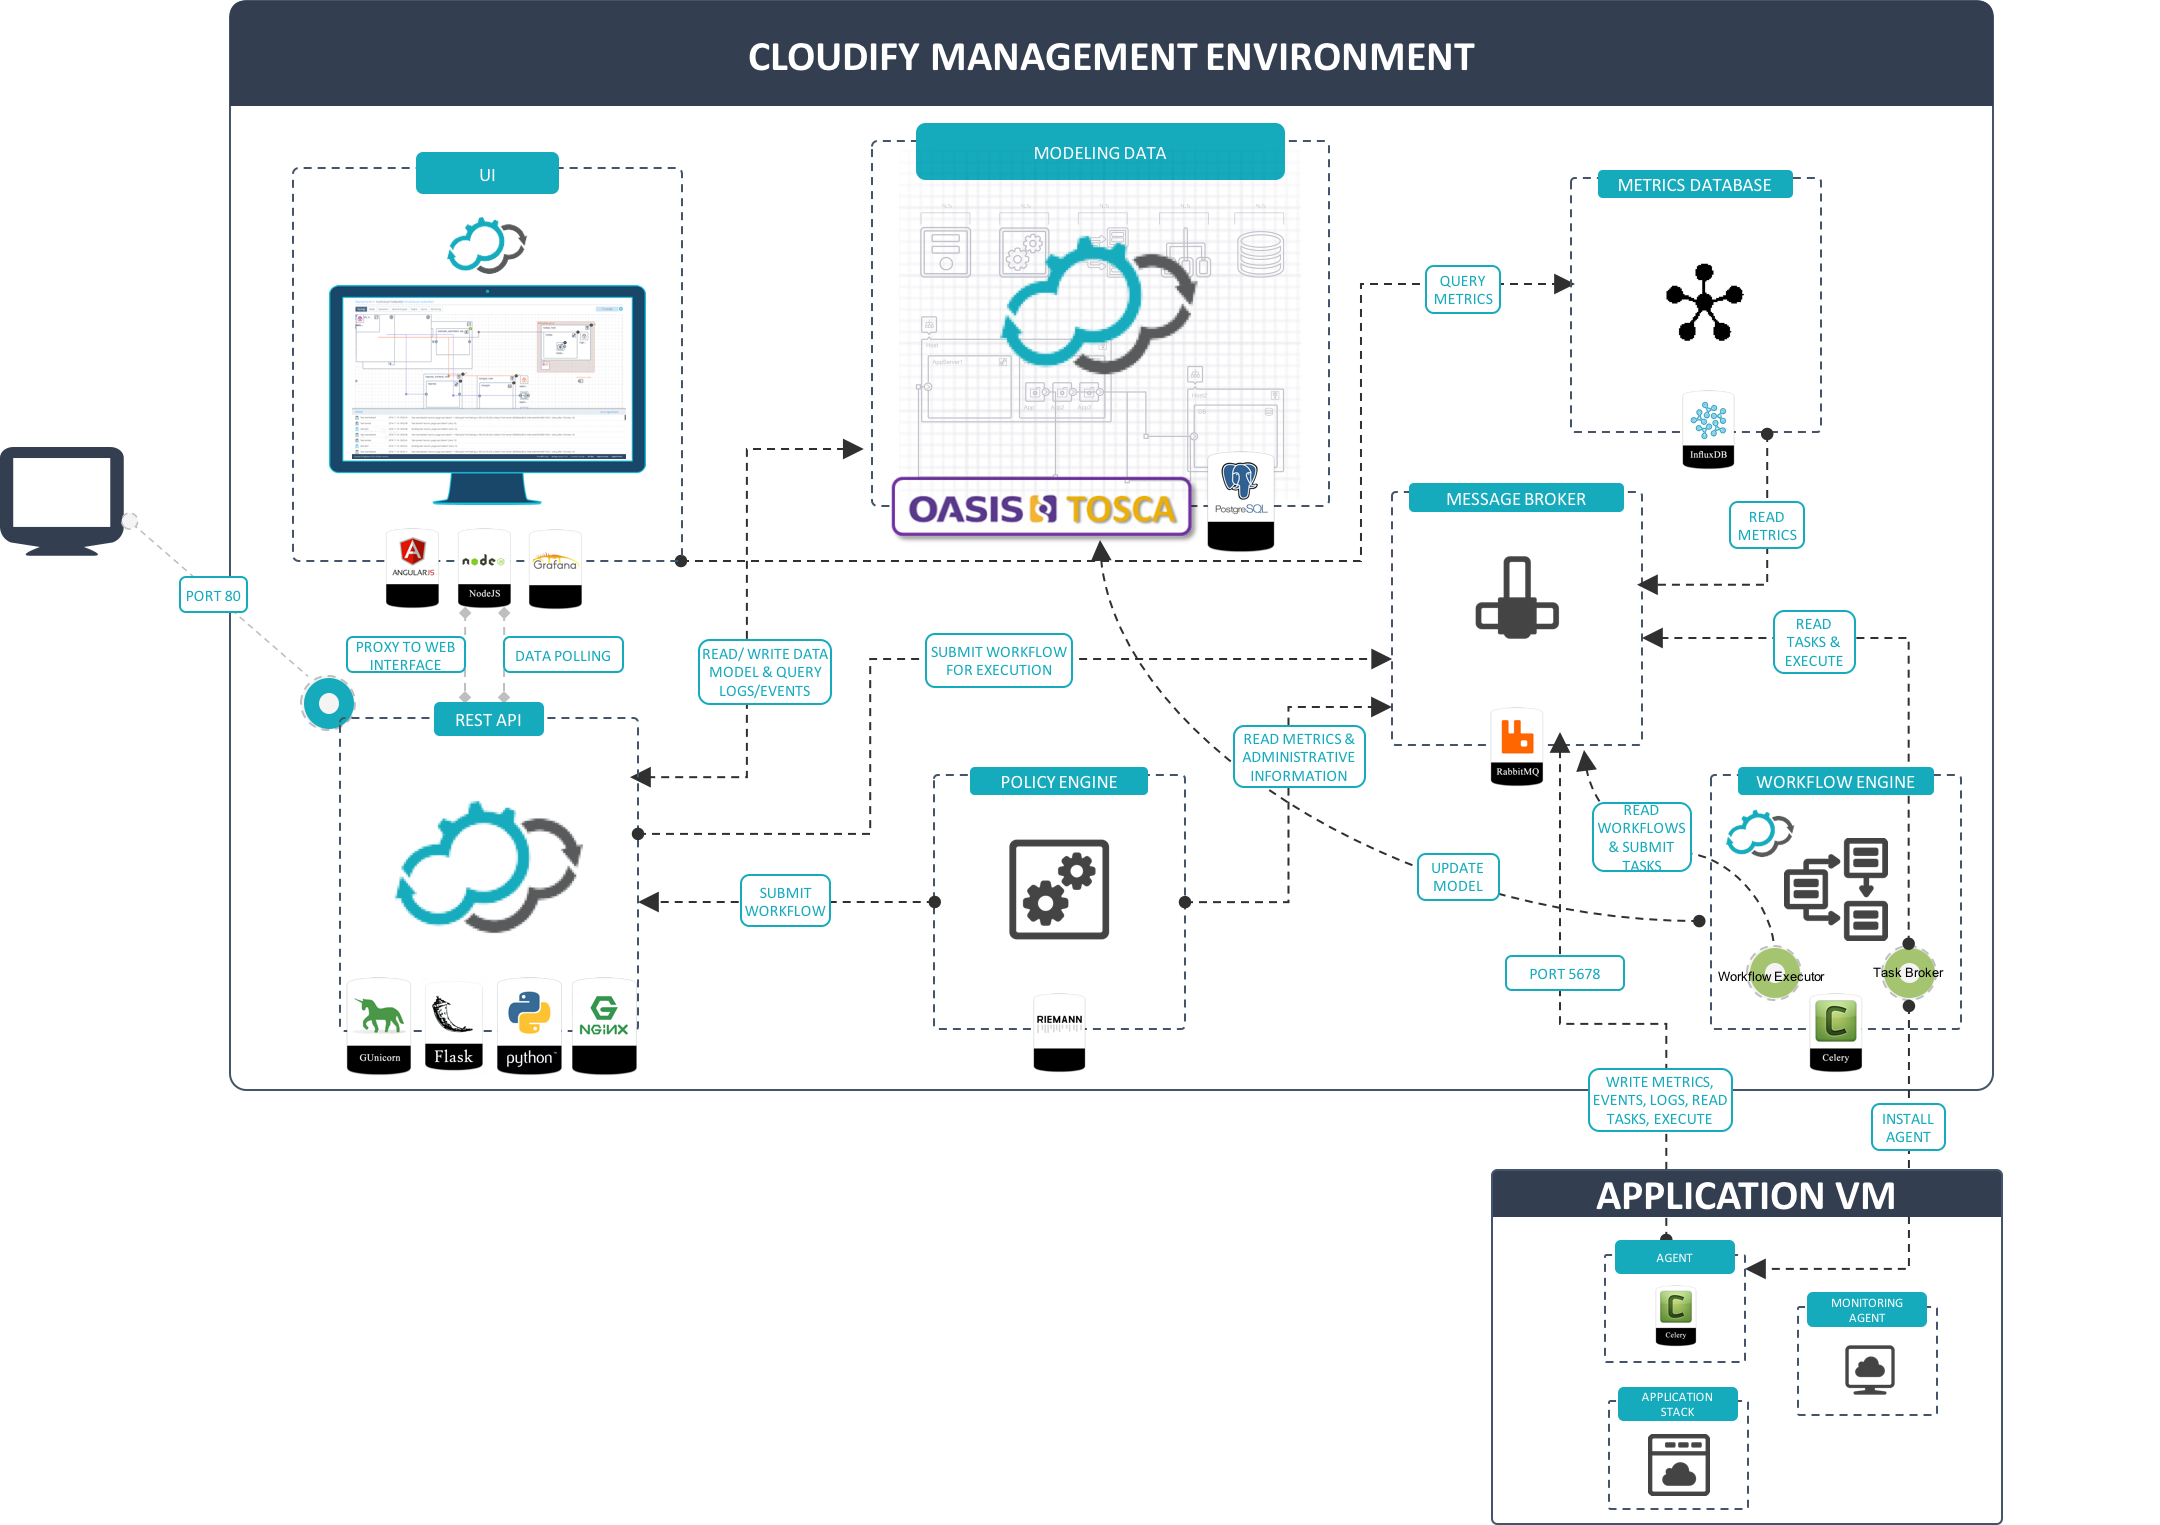
Overview of Open Source Components in Cloudify
Get the latest docs
You are looking at documentation for an older release. Not what you want? Go to the current release documentation.This section is to provide information about how the Cloudify architecture supports currently-implemented flows. Operational knowledge is assumed.
Cloudify Manager primarily comprises the following open-source components. Their relationship in the Cloudify Manager architecture is illustrated in the following diagram.

Ports and Entry Points
Rather than specifying the ports in each component’s overview, ports are specified here so that you can easily review network requirements.
External Ports
By default, there are two external networks from which the Cloudify management environment is accessed:
- The network on which the CLI resides, which is potentially a user’s
management network. - The network on which the application resides, which is potentially a user’s application network.
Therefore, Cloudify requires only two entry points to its management environment:
Ports 80 / 443 for user rest-service/UI access via Nginx
Port 5672 for application access via RabbitMQ
Port 53333 is exposed for FileServer access, with a
/resourcesprefix, for example,https://{manager_ip}:53333/resources/blueprints/default_tenant/blueprint_id/filename.yaml.Port 22 is exposed for SSH access, to enable the CLI to bootstrap the Cloudify management environment.
While this is currently a requirement in the default bootstrap method in the CLI, usinguserdata/cloudinitto bootstrap will make this requirement obsolete. However it is important to understand thatcfy sshwill not work in this case.The only external access to the management environment is not done through one of these entry points. It is achieved by the Cloudify agent on the host accessing Nginx directly, rather than through RabbitMQ to update the application’s model (for example, when runtime-properties are set).
Internal Ports
The following internal ports are exposed:
- The REST service is accessed via port 53333
- The UI is accessed via port 9100
- PostgreSQL exposes port 9200 for HTTP API access
- RabbitMQ exposes port 5672
- InfluxDB exposes port 8086 for HTTP API access
- Logstash exposes a dummy port 9999 to verify the communication is live
High Availability Ports
The following ports are used for managing high availability:
- Ingress IPv4 TCP 8300 0.0.0.0/0
- Ingress IPv4 TCP 8301 0.0.0.0/0
- Ingress IPv4 TCP 8500 0.0.0.0/0
- Ingress IPv4 TCP 15432 0.0.0.0/0
- Ingress IPv4 TCP 22000 0.0.0.0/0
- Ingress IPv4 TCP 53229 0.0.0.0/0
Nginx
Nginx is a high-performing Web server. In Cloudify Manager, it serves two purposes:
- A proxy for the Cloudify REST service and Web interface
- A file server to host Cloudify-specific resources, agent packages and blueprint resources.
File Server
The file server served by Nginx, while tied to Nginx by default, is not logically bound to it. Although currently it is accessed directly in several occurences (via disk rather than via network), we will be working towards having it completely decoupled from the management environment so that it can be deployed anywhere.
Gunicorn and Flask
Gunicorn is a Web server gateway interface HTTP server. Flask is a Web framework.
Together, Gunicorn and Flask provide the Cloudify REST service. The REST service is written using Flask, and Gunicorn is the server. Nginx, is the proxy to that server. The Cloudify’s REST service is the integrator of all parts of the the Cloudify environment.
PostgreSQL
PostgreSQL is an object-relational database that can handle workloads ranging from small single-machine applications to large Internet-facing applications.
In Cloudify Manager, PostgreSQL serves two purposes:
- Provides the main database that stores the application’s model (i.e. blueprints, deployments, runtime properties)
- Provides indexing, and logs’ and events’ storage
Logstash
Logstash is a data handler. It can push/pull messages using several inputs, and apply filters and output to different outputs.
Logstash is used by Cloudify to pull log and event messages from RabbitMQ and index them in PostGresSQL.
RabbitMQ
RabbitMQ is a queue-based messaging platform.
RabbitMQ is used by Cloudify as a message queue for different purposes:
- Queueing deployment tasks
- Queueing logs and events
- Queueing metrics
Currently not all requests between Cloudify’s Manager and the hosts it manages go through RabbitMQ. We aim to make it so.
Riemann
Riemann is an event stream processor used primarily for monitoring.
Riemann is used within Cloudify as a policy-based decision maker. For more information on policies, see the policies section.
Note
The use of Riemann as a policy engine in Cloudify is an experimental feature and, as such, is not guaranteed to be forward-compatible.
Celery
Celery is a distributed task queue.
The Cloudify management worker, the deployment-specific agents and the host agents are based on Celery.
Deployment-Specific Agents
Both the deployment workflow agent and the deployment agent that appear in the diagram are deployment specific. Two of these agents are created for every deployment.
- The
deployment workflow agentexecutes deployment-specific workflows. - The
deployment agentexecutes API calls to IaaS providers to create deployment resources, or submits tasks to RabbitMQ for execution by the host agents.
Note that all agents (management, deployment-specific, and host) are the same physical entity (a virtualenv with Python modules - Cloudify plugins installed in them).
Management Worker (or Agent)
An entity removed from the diagram is a management agent containing a Cloudify plugin able to spawn the aforementioned deployment-specific agents. This agent is run during the bootstrap process.
InfluxDB
InfluxDB is a time-series database.
- A proprietary metrics consumer is used to pull metrics from RabbitMQ and submit them to InfluxDB.
- InfluxDB is used by Cloudify to store metrics that are primarily submitted by the application’s hosts.
- Cloudify Web interface presents the metrics that are stored in InfluxDB in the Graph Widget components. In the widget’s settings you can choose one of the provided metrics, or define your own custom query.
