The Logs & Events Page
Get the latest docs
You are looking at documentation for an older release. Not what you want? Go to the current release documentation.
Logs & Events Page User Guide
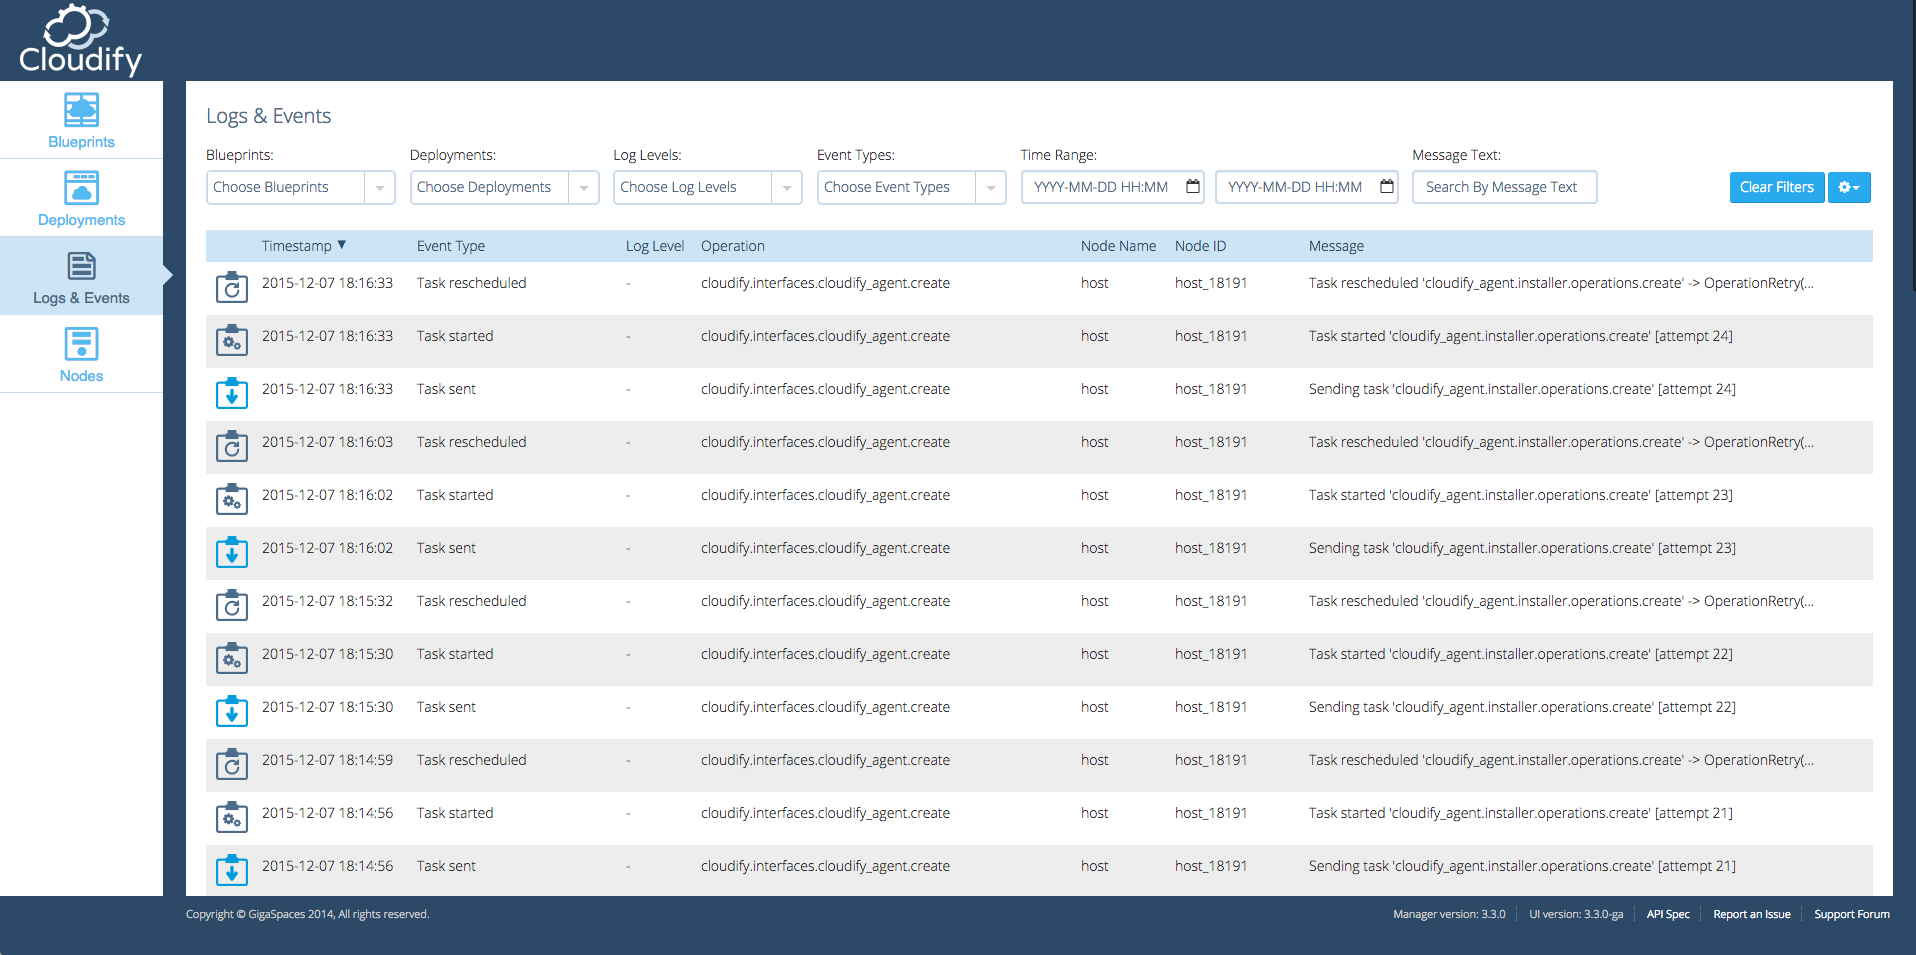
When clicking on the Logs & Events tab, you are presented with 50 event rows aggregated from all Blueprints and Deployments ordered by timestamp (descending).

You can control which logs & events are displayed by:
Filtering
Blueprints
To filter logs & events by specific blueprints choose one or more blueprints for which matching logs & events will be automatically updated.

Deployments
To filter logs & events by specific deployments choose one or more deployments for which matching logs & events will be automatically updated.

Log Levels
To filter logs & events by specific log levels choose one or more log levels for which matching logs & events will be automatically updated.

Event Types
To filter logs & events by specific event types choose one or more event types for which matching logs & events will be automatically updated.

Time Range
To filter logs & events from and to a specific timestamp use the time range filters.
The filters consists of 2 timepickers, each allows manually typing the timestamp expected to be in YYYY-MM-DD HH:MM format or choosing a date and time from the timepicker.
The first timepicker filters logs & events from the chosen timestamp while the second filters log & events to the chosen timestamp.
You can choose to filter using either of the timepickers or both.

Note
If it is unclear if your timestamp is valid, look for this icon. When it shows - the input is valid and the data is automatically changed to match the filter.

Message Text
To filter logs & events by a specific message’s text you can free type the text and matching logs & events will be automatically updated.

Clear Filters
To clear all of the filters you can click the ‘Clear Filters’ button.
Sorting
To sort logs & events click on the desired table’s header to switch the ordering between ascending, descending and none.

Pagination
50 logs & events are presented per page. You can use the pagination bar to scroll through the pages.

The Log/Event
By default the table does not present all of the log/event information. In order to reveal all of the log/event information simply click on the row itself.
An event example:

A log example:

Note
Not all logs/events have the same fields as there are some fields which are specific to logs and others which are specific to events.
For example Logger and Log Level fields are specific to logs while the Event Type field is specific to events.
Adjust The Table
By default the logs & events table presents all of the columns but you can choose which columns you would like the table to present.
Click on the icon, a dropdown menu containing all of the table headers names is presented.

Clicking on a header toggles if it should be presented. Additionally you can drag and drop headers to determine the ordering of the columns.
Here is an example of a customised table:

Persistency
While you adjust the table’s view by filtering, sorting and paging through it, those preferences are automatically saved as part of the page’s url.
For every unique set of table filtering, sorting and paging preferences there is a unique url to match it and when loading the page those preferences will be automatically loaded from the page’s url, thus adjusting the table’s view.
This for example allows you to refresh or bookmark the page or send the current page’s url as a link to a colleague without having to set the view’s preferences all over again when reloading the page.
Note
The table's view is the set of filtering, sorting and paging preferences applied to the table. The data for a specific view is dynamic and is not considered part of the view’s preferences.
For example sorting by timestamp descending is the default view that loads when routing to logs & events page, yet at a different points in time there could be different data for the same view - as new data is registered.
